
Jeremy Davis
Sitecore, C# and web development
I got the chance to speak at the Manchester Sitecore user group recently, introducing some tools and tricks that can be used to measure site performance while you're developing your Sitecore code. For anyone who wasn't there (and those who were but, want to refer back to what I said) here's a summary of the important bits of content from that talk...


My talk was inspired by some work I'd done a while back, on a site that was going to be used as the target of a big TV advert. The team involved in that project looked at the usual infrastructure and architecture issues of scaling a site, but I also made a point of checking the performance of components as we were developing using profiling tools. These are simple checks that you can incorporate into your day-to-day development workflow, with the goal of catching any obvious performance issues early in your project.
Most of us have probably experienced this scenario at some point: You write some code which looks like it was works well in development, and is also OK during functional testing. But then it grinds to a halt when it's used with large content trees or high loads. If you're lucky that happens during load testing, but maybe it's on production...
As you move from development towards release, the cost and difficulty of fixing issues like this tends to increase, so what can you do, in order to avoid that sort of issue happening in code you're working on now?
Here's what I suggested:
 The first tool I'd recommend you make use of is Sitecore's own profiling tool. This is part of the Experience Editor, and it seems like an under-appreciated gem to me. You don't have to pay any extra money for it, or do anything special to enable it. But it's great at helping you understand how your code interacts with Sitecore's Item APIs and rendering engine.
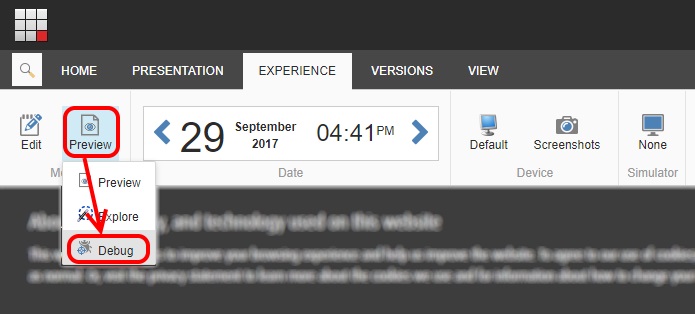
You can get access to this profiling data by opening a page of your site in the Experience Editor, and then clicking the "Preview" dropdown, to select the "Debug" option:
That will make the page refresh, and after your page's content it will show you the performance data that it captures:
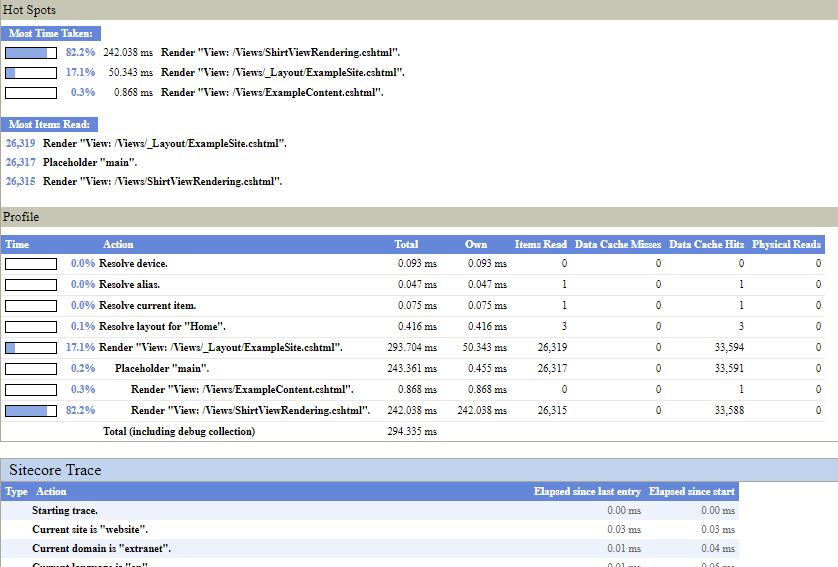
The first region, titled "Hot spots" shows you a summary of the data, highlighting the worst offenders. The final section "Sitecore Trace" shows any debug output written to Sitecore's trace framework while components executed. But the interesting bit (for me at least) is the middle section, "Profile".
This gives you the detail about each operation that's been performed in the course of rendering the page. They're listed out in execution order. But what do they all mean? Well here's one row from that data:

The "Time" column gives you a visual reference of how much of the page execution time this section the page is taking up. Alongside the "Total" (How much time this component and its children used) and "Own" (How much time just this component used) these let you understand how long the component took to render. When you're looking at these columns, you should be considering two things: Firstly, is this component taking a large chunk of the overall page time. Components which dominate the execution time are generally a good target for optimisation. Secondly, think about the execution time itself in the context of your goals for the responsiveness of your page – if the overall time is high, think about what you can investigate and adjust.
The "Items Read" column gives you an idea of how hard your components are hitting the Item APIs. Generally, larger numbers here are less good. Minimising the number of items you read for any component is generally a good thing. Check API queries, or operations that are mapping data to Sitecore Items, and think about if there are ways to reduce the numbers being read. Maybe making better use of Axes to focus the query's scope more efficiently, or maybe adding filtering clauses to do things like restrict the query by template ID.
The three caching columns "Data Cache Hits", "Data Cache Misses" and "Physical Reads" give you an idea of how your item accesses are working against the caches. In an ideal world, you want cache misses and physical reads to be zero. Accessing the content database is orders of magnitude slower than caches, as in most real-world scenarios your database server is at least one network hop away from your front-end servers.
It's worth remembering that in development you're usually looking at the best-case scenario for cache efficiency. There's only one user, accessing the site, and they're only looking at the one page you're measuring. That will tend to minimise cache misses because there's little churn going on. To get an idea of the worst case, it's helpful to use the Sitecore cache admin tool to clear the caches before refreshing the profiling stats here. You'll get significantly higher load times for your components when the cache is empty – giving you an idea of how physical reads and cache misses might make your component perform.
Another thing to remember is that start-up time will skew these numbers. If you refresh the profiling page after changing a config file, updating a DLL or similar, you will want to refresh the page a second time to ensure you see what's happening when ASP.Net's load times are not affecting the numbers.
The stats from this tool will give you good clues about where to look in your solution for less efficient code. Where you see components with larger numbers of items, check your queries. Look for opportunities to load fewer items: It's always better to exclude unwanted data in your queries than to load items and filter them out later. And where the execution time of components is higher, look for ways you can reduce the work the component does – sometimes custom use of the fragment caching APIs can make a big difference here. (Especially if the overall component cannot be cached)
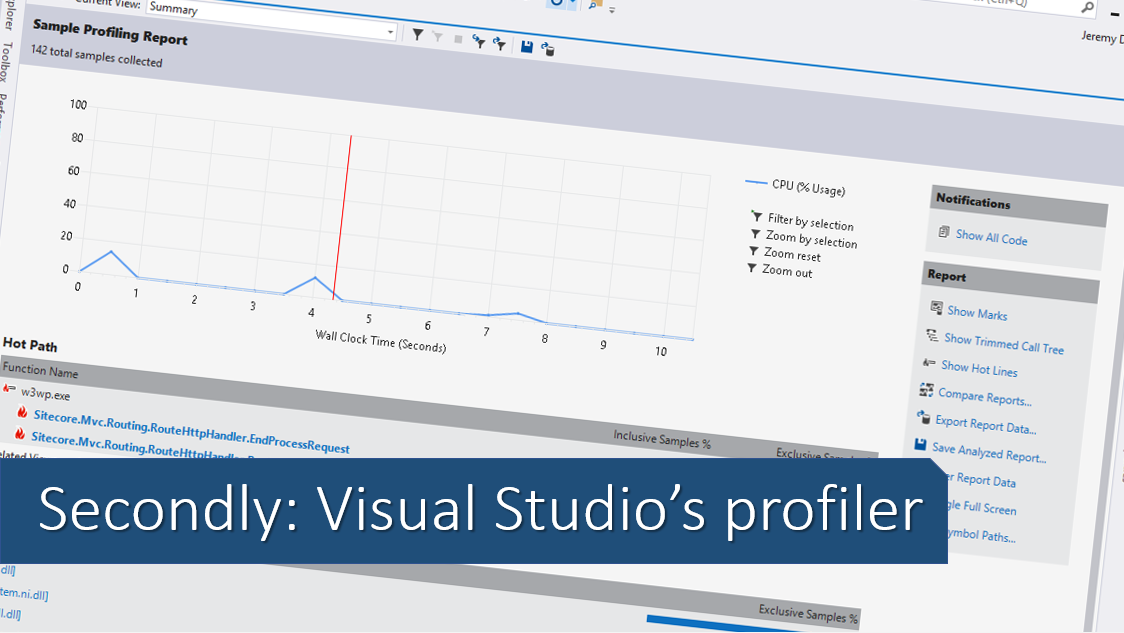
Visual Studio has two groups of tools that can be useful for analysing your code. The first of these is its performance profiler. This lets you look at the detail of the CPU usage of your code. This goes into more depth than the execution time measurements for individual components that Sitecore can provide, as it can look down to the level of individual lines of code in your C#. The second is the general debugger. While this can also give you data about CPU usage, it's most helpful for investigating how your code makes use of managed memory.
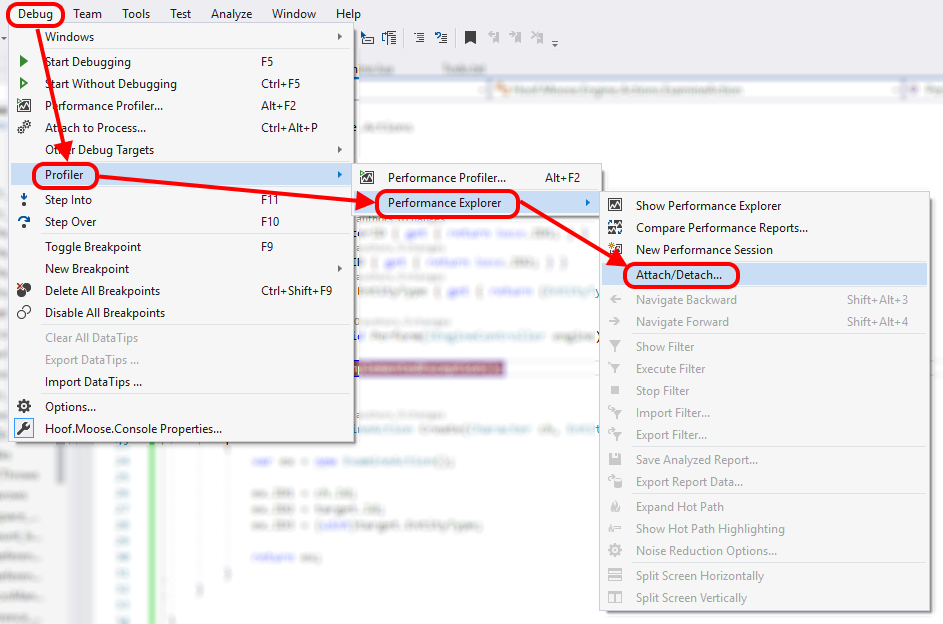
You can pick a process to attach the profiler to via the following menu option:
You then get to choose the process to attach to. When attaching to the IIS worker process running your Sitecore site you need to ensure the checkboxes for "Show processes for all users" and "Show processes in all sessions" are checked so you can see the web worker process you want to attach to.
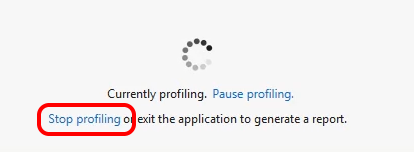
Once you've chosen a process, Visual Studio will inject the profiling code into it, and start recording data. You can then spend some time exercising your code. Refresh the page you're interested in, click on buttons that trigger post-backs or AJAX calls. And try to make sure you do each action a reasonable number of times to get a spread of data. Once you're done, click the "stop profiling" link...
...and Visual Studio will generate a report based on the data it has gathered. (Note that detaching the profiler from your application causes it to be unloaded from memory. That's to remove all the specialised profiling code that gets injected when you attach the profiler in the first place) It will then show you a summary of the report:
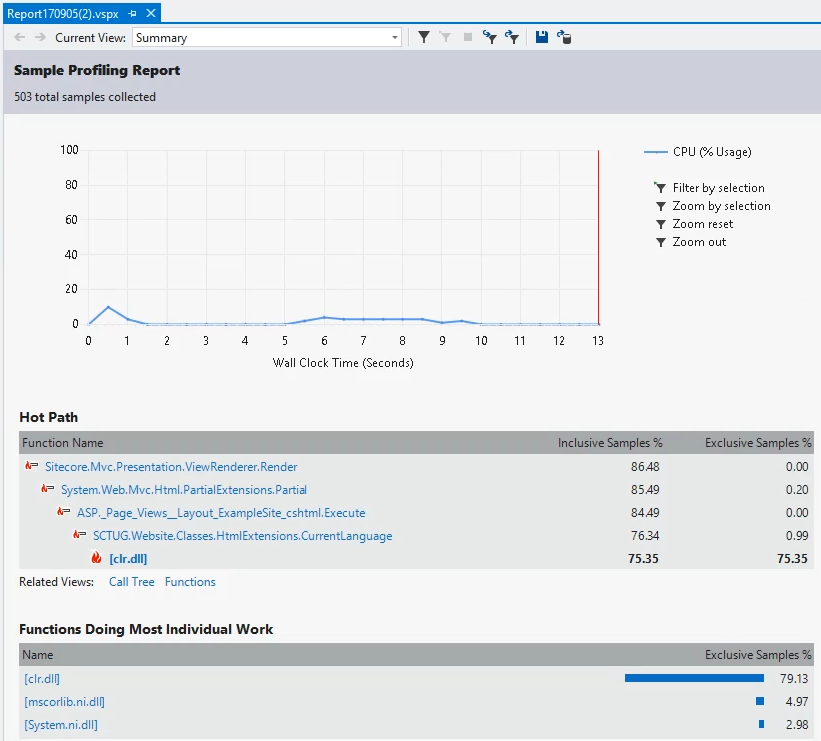
The first section of the page shows an overview of the CPU activity during the profiling. Your goal for any optimisation is to try and get this graph as low as possible overall – but it's a fairly coarse representation of the data.
The second section shows you the "hot path" for the execution – the route through the code which has consumed the largest chunk of the CPU time during your profiling session. This is a really helpful shortcut to finding places that you can optimise. Seeing code from your solution in this list is a definite signal that you have some optimisation to do. You want this list to include only framework or Sitecore code.
The third section describes the code which is doing the most work. Again, you only want to see framework code here if possible.
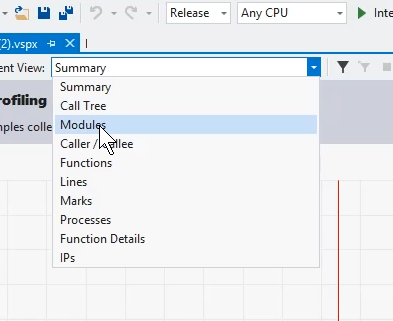
The summary of the report will give you an overview of what's going on, but a more detailed view will help you focus on what aspects of your code are the best candidates for optimisation. I tend to start with the "Modules" page of the report, accessed from the drop-down list at the top of the page:
That gives you more detailed stats, broken down by the DLLs that have been loaded into the process:
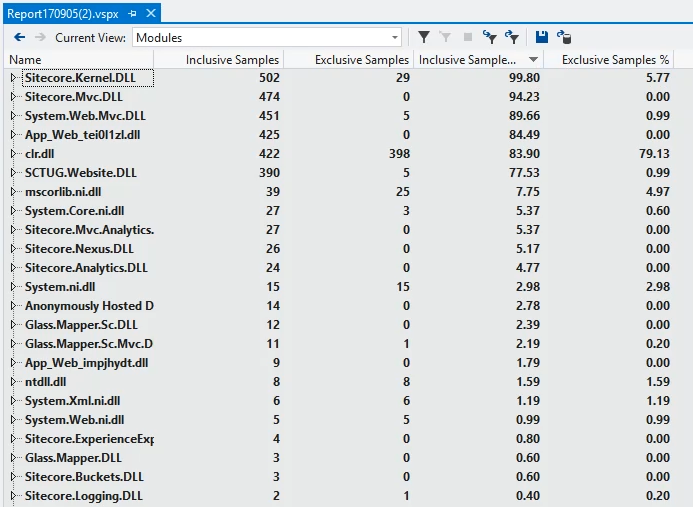
The stats are broken down into four columns. The first two show "Inclusive" and "Exclusive" samples. Like the timing data from the Sitecore profiler, that's data for "this method, and any child methods it calls" and "this method on its own". The second two columns show this same data but expressed as a ratio of overall execution time, rather than an absolute number. I tend to sort by "Inclusive samples %" initially, as it gives a good idea of the relative expense of each bit of code.
Don't get too bogged down in the exact numbers here – there are lots of things going on in the system which can affect these numbers from session to session in ways you cannot control. You want to focus on the relative values – trends in how the numbers change after you make modifications. And, as everywhere else here, you want your changes to try and reduce the numbers. And it's generally a bad sign if code you wrote is near the top of this list.
You can drill down to individual methods by expanding the node for a DLL you're interested in. And if you spot something in your code that's worth further investigation, double-clicking the method in this list will take you to a details view which shows the call path and details of which bit of code is using the most CPU time:
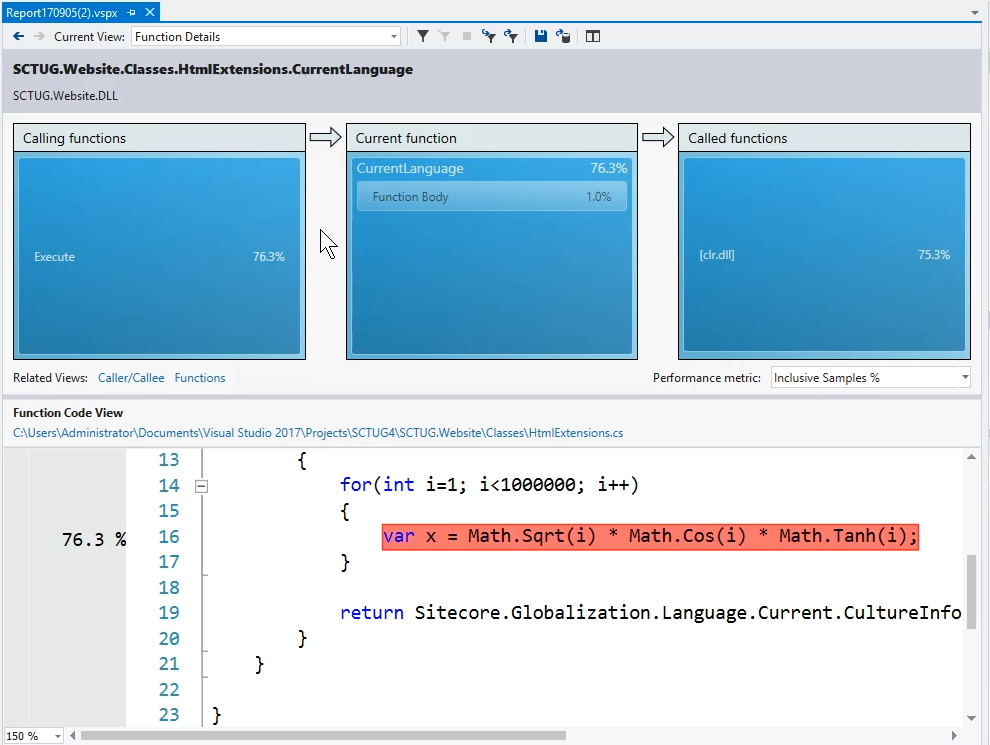
The UI does a great job of highlighting exactly where in your code most of the CPU time is going – so if you've accidentally put some really silly code into your solution that's wasting a load of CPU time, you can see find it very easily... (Yes, my presentation examples were deliberately caricatured 😉 )
Once you've worked out the best places to adjust your code, you should make your optimisations and then re-measure it. Sometimes changes you make can end up making the code slower, due to the complexities of how it's processed by the framework and your CPU. So that re-test is important to ensure you're getting the benefits you hope for.
You can do this easily by attaching the standard Visual Studio debugger:
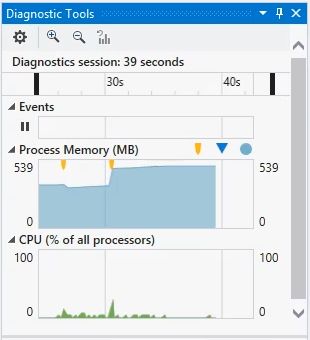
By default you get graphs of memory usage and CPU over time while the debugger is attached. The memory graph gives you a simple way to watch trends over time. As you exercise your site, you you want to watch the slope of this trace. It's ok if the graph stays roughly flat, or oscillates up and down over time. But you don't want to see a graph which has an upward trend over time – that indicates something is consuming more and more memory – which is likely to lead to issues when left long enough. (The yellow markers on the graph indicate points when the garbage collector kicked in)
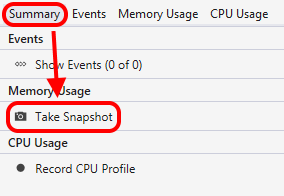 While this is a nice visual way of seeing the behaviour of the site over time, it doesn't give much detail. But the debugger has a neat trick for helping you here. Below the graphs are some tabs, and they include an option to "take a snapshot". That gets the runtime to record data about the current state of the managed heap – what objects are on it, and how much space they're occupying. You can take one snapshot at the beginning of your debugging session and then exercise your code for a bit. Once you've seen the trend you want to analyse on the overview graph, you can take a second snapshot.
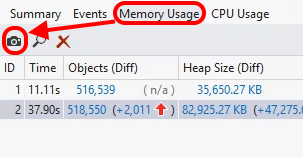 Once you have more than one snapshot, Visual Studio will show you a summary of the changes between them. A red upward arrow indicates "memory usage went up" and the overview tells you what happened both for the count of heap objects and the size of them. Green arrows indicated the values went down. Clicking on this summary will open a report that gives you the details of the difference between your snapshots. This gives you a list of all the object types that are in memory, alongside their change in size and change in count. As before, you can sort this list to show the data in different orders:
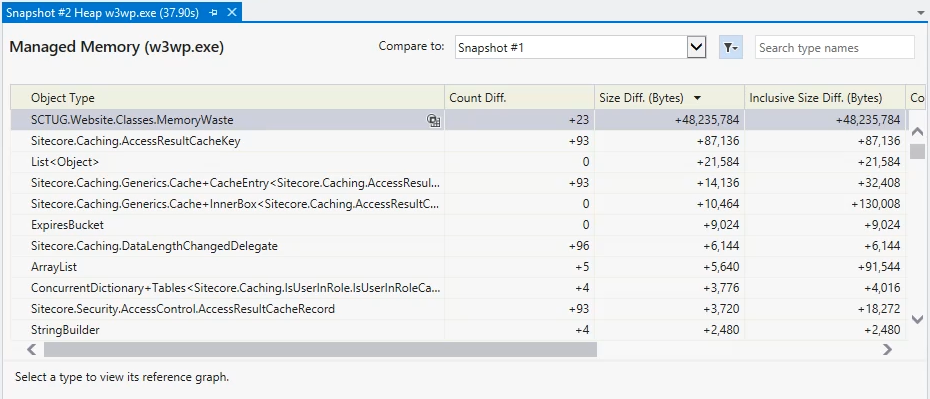
Whichever way you sort it, ideally you don't want code from your codebase near the top of this list, as that implies that it's using increasing amounts of resources. Where you find objects that are going up over time, you can use "Find References" in your codebase to find where the object is being used and investigate whether you can reduce the usage or improve the effect of garbage collection by releasing references you no longer need.
As with the previous measurements, after you've made some changes you should always recompile and re-test your code, just to make sure the change you made had the effect you wanted.
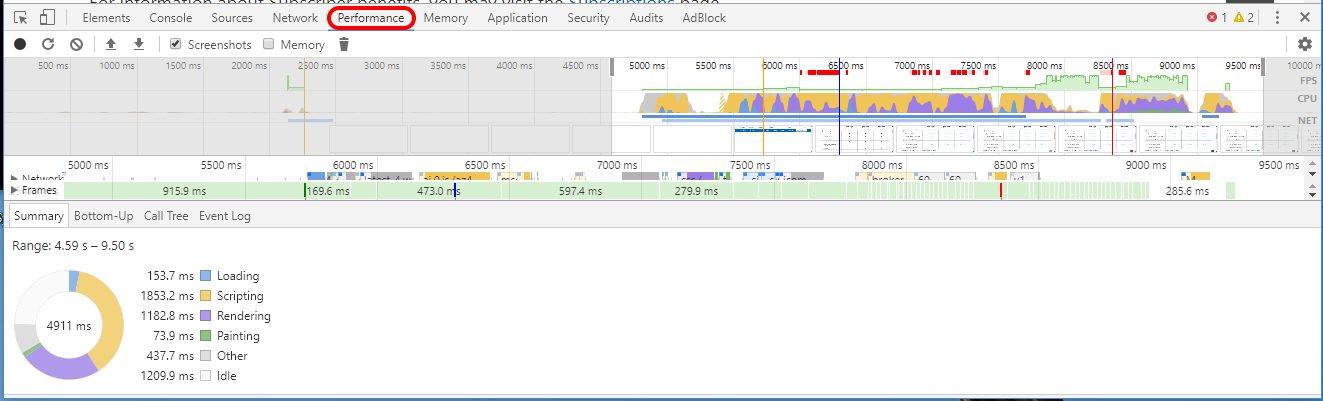
It wasn't part of my original presentation, but in the Q & A afterwards, we discussed the idea that your front-end code can be examined too. For that your browser's dev tools are useful. They can help you look into the rendering and scripting performance of your site, as well as the network-centric performance issues like how many files are being loaded. In Chrome, for example, you can see very detailed rendering performance data:
If you can set aside a small amount of time as you work on each bit of code for your site, you can give it a quick check for performance issues. Spotting things like inefficient Sitecore queries, or memory leaks at this point will be much less hassle for you than finding them in production. So I'd recommend you try and fit these sort of checks into your work whenever you can...
Thanks to everyone who helped make this user group event a success – the presenters, the audience, the pizza chef, and Kagool for hosting.
See you all again at the next one, hopefully...
↑ Back to top