
Jeremy Davis
Sitecore, C# and web development
Recently I was looking into how custom caching might improve the performance of Layouts in Sitecore. But one important aspect of the concept of improving performance with tricks like that which I didn't discuss was how you can work out places where caching will give you benefits...
 url copied!
For the work I was doing recently, I combined two techniques:
url copied!
Stopwatch sw = new Stopwatch();
WebClient client = new WebClient();
string url = "https://mysite/some-page";
long totalTime = 0;
int totalRequests = 1000;
int requestCount = 0;
for(int i=0; i<totalRequests; i++)
{
sw.Reset();
sw.Start();
requestCount += 1;
Stream stream = client.OpenRead(url);
StreamReader reader = new StreamReader(stream);
String content = reader.ReadToEnd();
reader.Dispose();
sw.Stop();
totalTime += sw.ElapsedMilliseconds;
}
float avg = totalTime / requestCount;
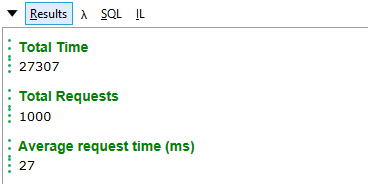
totalTime.Dump("Total Time");
requestCount.Dump("Total Requests");
avg.Dump("Average request time (ms)");
Fetching only the HTML helps by filtering out the code that generates pages from the code that does things like resize images or bundle Javascript. Focusing your tests like this helps get a clearer view of code performance. You can, of course, run separate tests for fetching CSS / Javascript or images and do performance work on those paths too.
The result of running the script above is an estimation of the average response time for the code per fetch of the HTML:
url copied!
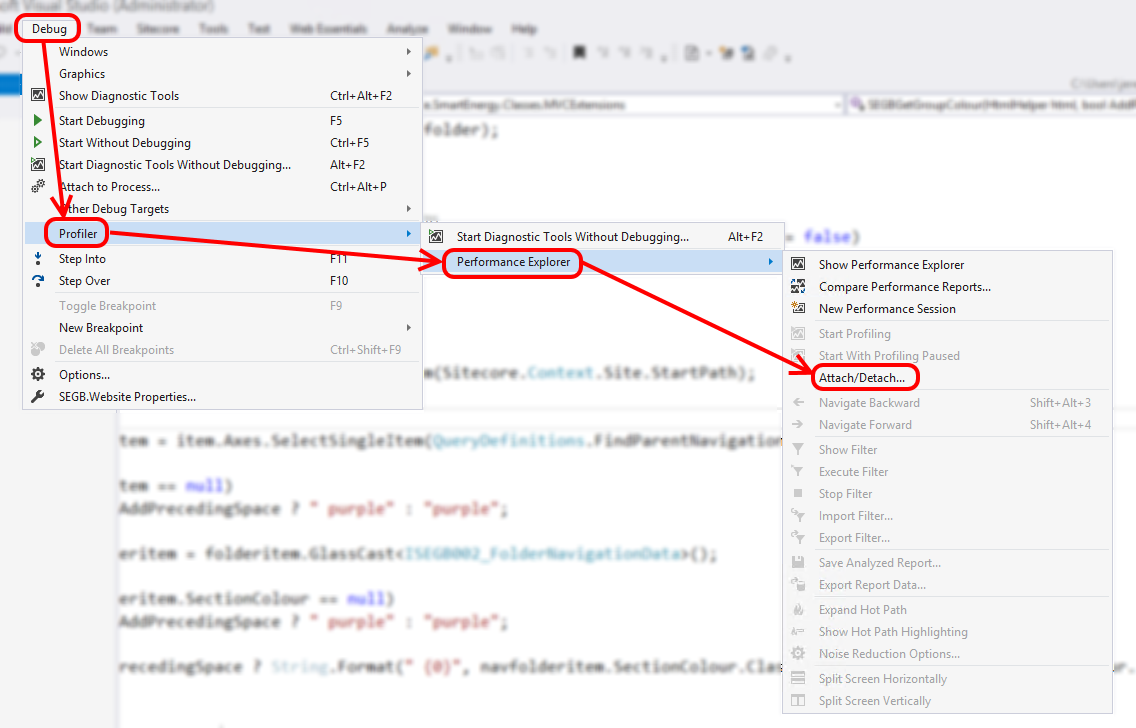
(Remember you'll need "Show processes from all users" and "Show processes from all sessions" ticked in the "Attach Profiler to Process" dialog, in order to find the "w3wp" process to attach) Once you see this:

you can generate your load again (by running the script above again in my case), and once that's done you can click the "Stop" link in Visual Studio. At that point you get a shiny report:
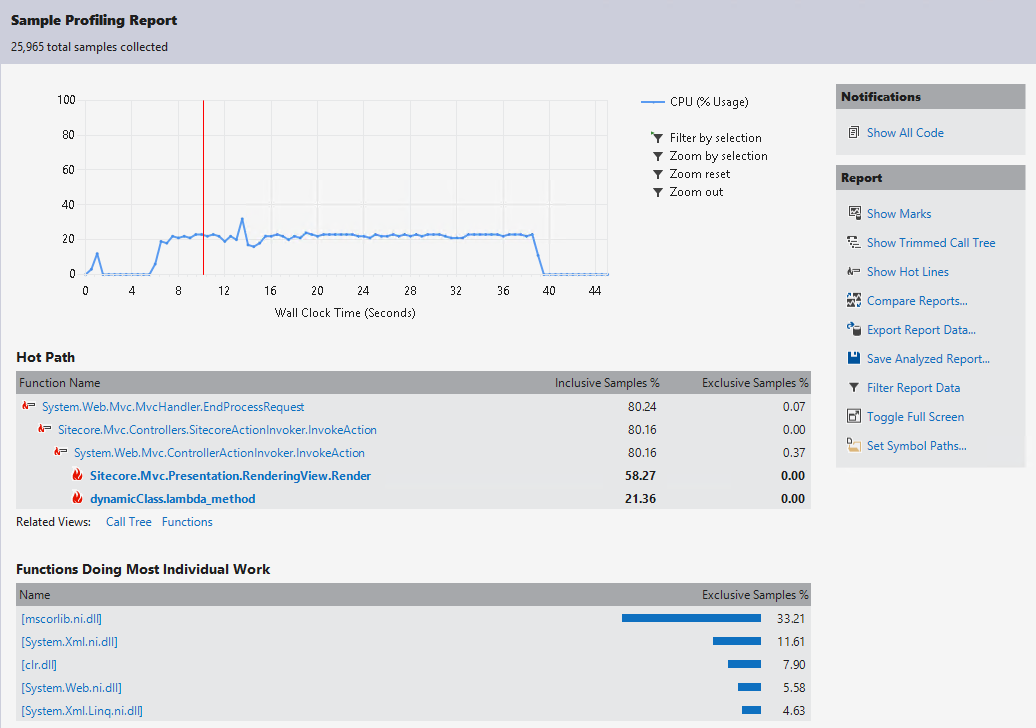
That's all very pretty, but it's not massively helpful in itself. Unsurprisingly, the code taking up the most CPU time in the summary is .Net and Sitecore code – neither of which offer much chance for you to optimise. So change the report from the "Summary" view that's the default to the "Modules" view, and click the "Inclusive Samples %" column to sort the list by "how many times the profiler found itself in a particular function and its children". That gives you a list where you can easily see the relative effort of your code versus the rest of the system:
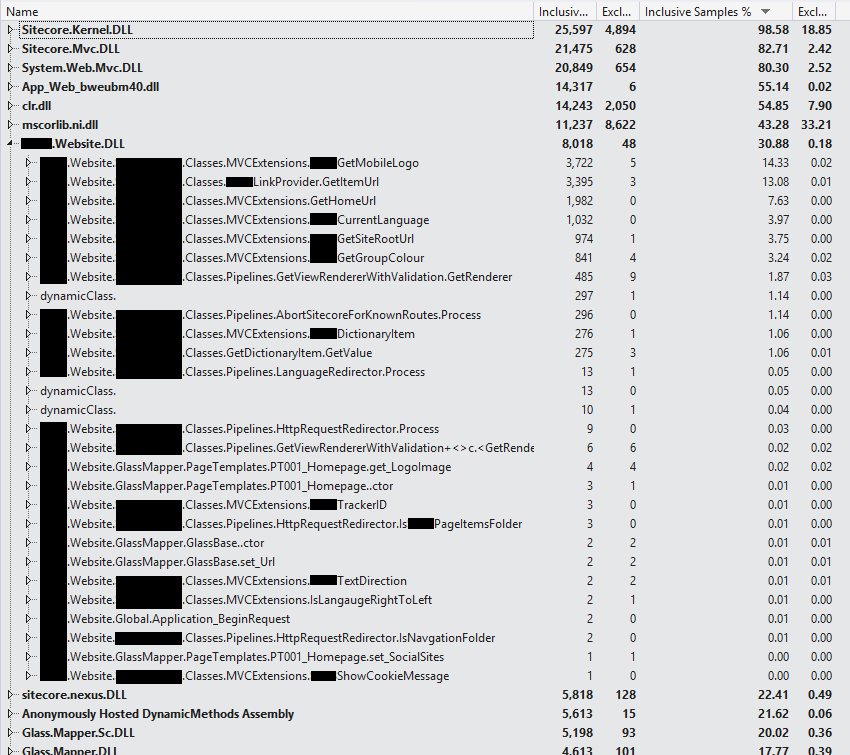
Note to self: Choose an example that requires less redacting next time... 😉
url copied!
Try out whatever techniques seem to make sense to the code you're looking at. On top of the usual Sitecore caching options, you can look at things like:
But for each change you make, you should measure again. If the change was effective you should see a repeatable fall in the load time. For example, when I applied my custom caching trick to the calls under MVCExtensions in the trace above, I saw:
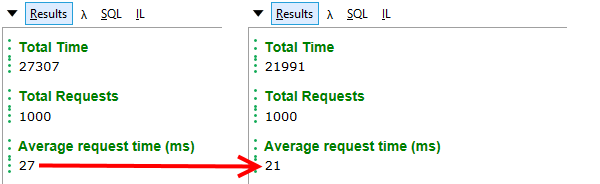
A small, but significant improvement with each request. And you should see the relevant bit of code dropping down the profiling list as well.
It's probably worth pointing out that the profiling and the fact you're probably testing against development hardware will have a performance impact on your code – so you shouldn't treat any numbers here as absolute timings. It's relative changes that you need to think about for the purposes of this sort of work.
You may also want to run similar tests against requests for images (or other resources being served out of Sitecore) that involve any custom code.
url copied!