
Jeremy Davis
Sitecore, C# and web development
I've had a Raspberry Pi sitting under my desk for some time now, but things keep getting in the way of me doing much with it. But in honour of the whole "March is for Makers" thing, I decided I needed to finally do something more than boot it up and let my son tinker with Scratch on it. I'd also acquired a "Sense Hat" add-on recently, and something about the matrix display on that made me think of animated graphs. Now that the Windows 10 IoT build is gaining features, I thought I'd try installing that and building something that would let me graph website activity – with a view to how it might get connected to Sitecore...
 url copied!
But the first step is to follow Microsoft's instructions for installing Win10 on your Pi, and then add the appropriate bits to Visual Studio for creating a new "headless" project. Then, on to the code:
url copied!
public sealed class Tracker
{
    private object _lock = new object();
    private int _currentTick = 0;
    private int _historyCount;

    private Queue<int> _queue = new Queue<int>();

    public Tracker(int historyCount)
    {
        _historyCount = historyCount;

        for (int i = 0; i < _historyCount; i++)
        {
            _queue.Enqueue(0);
        }
    }

    public IEnumerable<int> Tick()
    {
        lock (_lock)
        {
            _queue.Enqueue(_currentTick);
            _currentTick = 0;

            if (_queue.Count >= _historyCount)
            {
                _queue.Dequeue();
            }

            return _queue.ToList();
        }
    }

    public void Track(int value)
    {
        lock (_lock)
        {
            _currentTick += value;
        }
    }
}
The
Track()
method adds the number of events specified to the current count. This operation is guarded by a lock to ensure that we don't try to update the current count while we're also trying to move that data into the queue.
Calling the
Tick()
method does two things. Firstly it moves the current event count into the queue of event count history, and removes the oldest count. Secondly it returns the current state of the queue so that we can draw it on our graph.
Note that this class is sealed in order to meet the requirements of exportable classes in Universal apps - the compiler requires them to be sealed.
url copied!
public sealed class HttpReceiver
{
    private class RequestPayload
    {
        public string Origin { get; set; }
        public string Data { get; set; }
    }

    public event TypedEventHandler<HttpReceiver, string> DataReceived;

    private uint _bufferSize = 1024;
    private int _port;
    private StreamSocketListener _listener;

    public HttpReceiver(int port)
    {
        _port = port;

        _listener = new StreamSocketListener();
        _listener.Control.KeepAlive = true;
        _listener.Control.NoDelay = true;

        _listener.ConnectionReceived += async (s, e) => { await processRequestAsync(e.Socket); };
    }

    public void Start()
    {
        Task.Run(async () => {
            await _listener.BindServiceNameAsync(_port.ToString());
        });
    }

    private async Task processRequestAsync(StreamSocket socket)
    {
        string data = await readSocket(socket);
        RequestPayload payload = extractPayload(data);

        if (DataReceived != null)
        {
            DataReceived(this, payload.Data);
        }

        writeResponse("OK", payload.Origin, socket);
    }

    private RequestPayload extractPayload(string httpRequestData)
    {
        var lines = httpRequestData.Split(new[] { Environment.NewLine }, StringSplitOptions.RemoveEmptyEntries);

        var origin = lines.Where(o => o.Contains("Origin:")).Select(o => o.Substring(8)).FirstOrDefault();
        var result = lines.Last().Replace("\0","");

        return new RequestPayload() { Origin=origin, Data=result };
    }

    private async Task<string> readSocket(StreamSocket socket)
    {
        StringBuilder request = new StringBuilder();
        byte[] data = new byte[_bufferSize];
        IBuffer buffer = data.AsBuffer();
        uint dataRead = _bufferSize;
        using (IInputStream input = socket.InputStream)
        {
            while (dataRead == _bufferSize)
            {
                await input.ReadAsync(buffer, _bufferSize, InputStreamOptions.Partial);
                request.Append(Encoding.UTF8.GetString(data, 0, data.Length));
                dataRead = buffer.Length;
            }
        }

        return request.ToString();
    }

    private void writeResponse(string html, string origin, StreamSocket socket)
    {
        byte[] bodyArray = Encoding.UTF8.GetBytes(html);

        using (var outputStream = socket.OutputStream)
        {
            using (Stream response = outputStream.AsStreamForWrite())
            {
                using (MemoryStream stream = new MemoryStream(bodyArray))
                {
                    string header = String.Format(
                        "HTTP/1.1 200 OK\r\n" +
                        "Access-Control-Allow-Origin: {0}\r\n" +
                        "Content-Length: {1}\r\n" +
                        "Connection: close\r\n" +
                        "\r\n",
                        origin, stream.Length);
                    byte[] headerArray = Encoding.UTF8.GetBytes(header);
                    response.Write(headerArray, 0, headerArray.Length);
                    stream.CopyTo(response);
                    response.Flush();
                }
            }
        }
    }
}
The class binds the specified port, and waits for requests. For each one that appears, it parses the data supplied to extract the a posted value and any origin data supplied. It then returns an "ok" message to indicate that data was accepted. The Origin header is necessary if you're going to use AJAX-style requests across domains to record events. Note that this code simply records the incoming origin and plays back the same origin when it returns its response. That will allow any other domain to make requests – you would probably want to tie this down to only accepting some origins if this code was ever exposed to the internet.
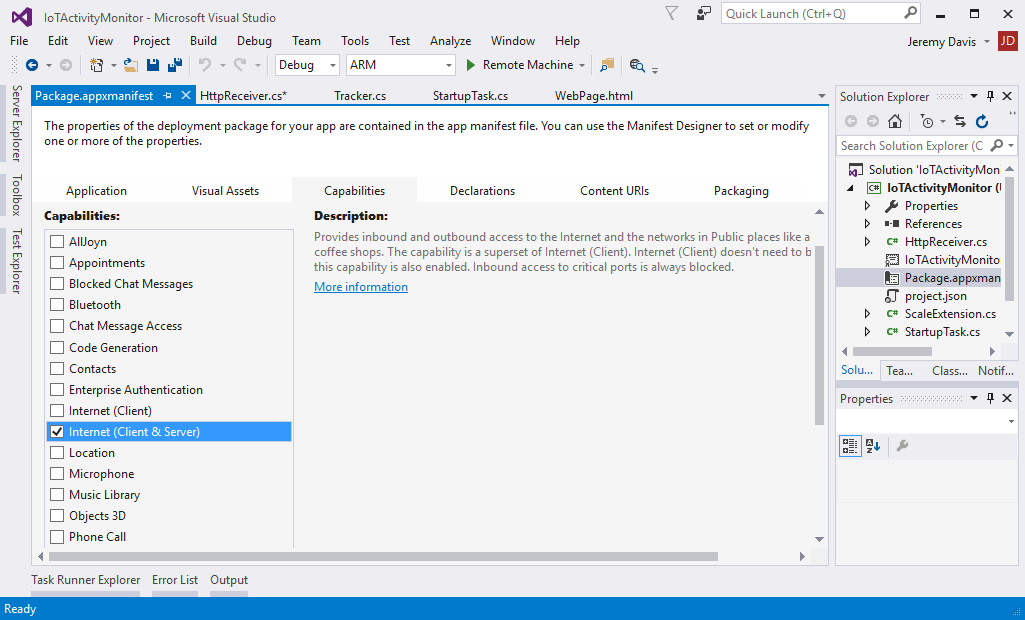
It's also worth knowing that acting as an internet server is a feature that you have to tell the Windows runtime you require when writing IoT applications. The application's manifest data needs to include data specifing this. It can be set in the UI by double-clicking the project's manifest file and ensuring that the "Internet (Client & Server)" option is checked:
url copied!
The whole device is wrapped up in an object you can obtain via an async call:
var _hat = await SenseHatFactory.Singleton.GetSenseHat();
And we can draw on the screen by setting individual pixels to a specific colour:
_hat.Display.Screen[4, 2] = Windows.UI.Colours.Red;
And then once all the updates are done, refresh the display:
_hat.Display.Update();
The display is represented by an 8×8 array of
Colour
entries.
(The library does loads more than this - but this is all we need to get started)
url copied!
public sealed class StartupTask : IBackgroundTask
{
    private BackgroundTaskDeferral _deferral;
    private Tracker _tracker = new Tracker(8);
    private HttpReceiver _receiver;
    private ThreadPoolTimer _timer;
    private ISenseHat _hat;

    public void Run(IBackgroundTaskInstance taskInstance)
    {
        _hat = SenseHatFactory.Singleton.GetSenseHat().Result;

        _deferral = taskInstance.GetDeferral();

        _receiver = new HttpReceiver(1234);
        _receiver.DataReceived += webMessage;
        _receiver.Start();

        _timer = ThreadPoolTimer.CreatePeriodicTimer(_timer_Tick, TimeSpan.FromSeconds(1));

        _hat.Display.Clear();
        _hat.Display.Update();
    }

    private void webMessage(HttpReceiver sender, string data)
    {
        int value = 1;
        if (!string.IsNullOrWhiteSpace(data))
        {
            int.TryParse(data, out value);
        }
        _tracker.Track(value);
    }

    //
    // More below
    //
}
It (synchronously in this case) gets an instance of the Sense Hat wrapper, and makes sure we have the "deferral" object we need to prevent the application being terminated before we're done. It then binds the HTTP server to a port and sets up a handler for incoming requests. The
webMessage()
handler tries to parse a number of events to record out of the data from the request, and then records that value using the tracker object.
Finally it creates a timer event which will cause the graph to be updated every second, before clearing the Sense Hat's display.
Each time that timer calls its handler, it runs the code to update the graph:
private void _timer_Tick(ThreadPoolTimer timer)
{
    var ints = _tracker.Tick()
        .Reverse()
        .Scale(8)
        .ToArray();

    for (int x = 0; x < 8; x++)
    {
        for (int y = 0; y < 8; y++)
        {
            Color c = colourFor(y, ints[x]);
            _hat.Display.Screen[y, x] = c;
        }
    }

    _hat.Display.Update();
}

private Color colourFor(int y, int value)
{
    if(y < value -1)
    {
        return Colors.Green;
    }
    else if(y < value)
    {
        return Colors.Red;
    }
    else
    {
        return Colors.Black;
    }
}
When the timer ticks, the code captures the data from the tracker object. It then reverses the order of the data, scales it to fit the 8 pixel high display, and returns an array. The code can then loop through each of the pixels on the display and set their colour based on the graph information. The helper function
colourFor()
returns the right colour for a pixel. The graph is drawn with green bars, topped with red.
Dynamically scaling the graph to ensure that the largest value never exceeds 8 pixels high is achieved via an extension method:
public static class ScaleExtension
{
    public static IEnumerable<int> Scale(this IEnumerable<int> source, int max)
    {
        int sourceMax = source.Max();

        if(sourceMax > max-1)
        {
            float scale = (float)max / (float)sourceMax;
            return source.Select(i => (int)Math.Ceiling(i * scale));
        }
        else
        {
            return source;
        }
    }
}
This simply returns a new enumerable where the values have been scaled appropriately.
url copied!
<body>
    <h1>Event test page</h1>
    <fieldset class="config">
        <legend>Network config for your Raspberry Pi</legend>
        <div>
            <label for="ip">IP Address: </label>
            <input type="text" id="ip" value="169.254.98.224" />
        </div>
        <div>
            <label for="port">Port: </label>
            <input type="text" id="port" value="1234" />
        </div>
    </fieldset>
    <div class="cmd">
        <a class="btn ck" href="#">Event</a>
        <span class="ck">...</span>
    </div>

    <script type="text/javascript">
        $(document).ready(function () {
            $("a.ck").click(function () {
                var msgElement = $(this).parent().children("span.ck");
                jQuery.ajax({
                    url: getUrl(),
                    data: "1",
                    dataType: "text",
                    crossDomain : "true",
                    method: "POST",
                    timeout: 500
                }).fail(function (jqXHR, textStatus, errorThrown) {
                    msgElement.text("Error: " + textStatus);
                }).success(function (data) {
                    msgElement.text("Success: " + data);
                });
            });
        });

        function getUrl() {
            var ip = $("#ip").val();
            var port = $("#port").val();
            return "http://" + ip + ":" + port + "/";
        }
    </script>

</body>
Each time the "Fire an event" link is clicked, an HTTP request is sent to the Pi, and the success or failure of the request is shown on screen. If we load that HTML file in a browser we get this:
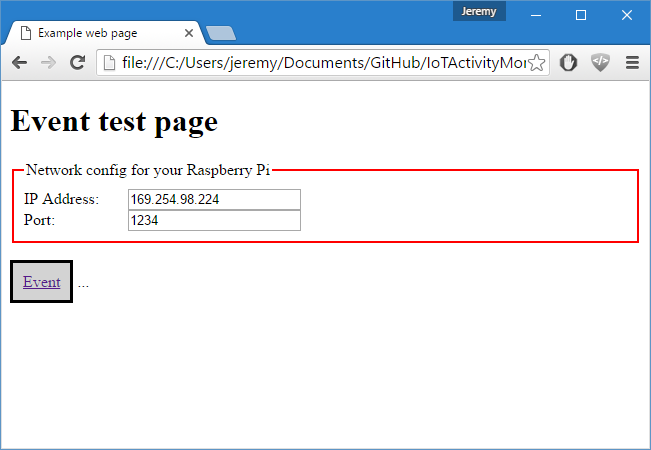
If we fire up the code on the Pi and then click the "event" button a bit, we'll see something like this:
The graph animates nicely, and will re-scale itself dynamically to ensure that it always fits vertically into the 8 "pixels" of the display.
(The complete code for this is available on Github if you want to try it)
url copied!
That approach will also work in a Sitecore website – but there are other ways you could wire it up here too.
It could also be wired up server-side by implementing a custom pipeline step or event handler. There's all sorts of stuff you could track via this route. Instead of tracking page requests via the
<HttpRequestBegin>
pipeline, you might want to track item saves on happening on your server via the
item:saved
event. At it's very simplest, that could could be some code like this:
public class TrackingEvents
{
    public void OnItemSaved(object sender, EventArgs args)
    {
        // fetch this from configuration
        var uri = "http://169.254.98.224:1234/";

        using (HttpClient client = new HttpClient())
        {
            await client.GetAsync(uri);
        }
    }
}
configured with a patch like:
<?xml version="1.0" encoding="utf-8" ?>
<configuration xmlns:patch="http://www.sitecore.net/xmlconfig/">
  <sitecore>
    <events>
      <event name="item:saved">
        <handler type="BlogExample.TrackingEvents, BlogExample" method="OnItemSaved"/>
      </event>
    </events>
  </sitecore>
</configuration>
With a little more effort, it would be sensible for the event code to pick up its target URL from configuration. For high load sites it might also be sensible to batch up requests on the server and pass the number in the batch, using a
Post
request as in the Javascript above.
Sitecore has a vast number of different pipelines and events that you might track. With a bit more code it would be fairly easy to allow the Pi to track data for multiple different events here, and swap between displays for each of them using the Sense Hat's joystick.
But who knows when I'll have some free evenings to give that a go...
↑ Back to top