
Jeremy Davis
Sitecore, C# and web development
Working on a couple of personal projects recently, I've been reminded again how helpful I find the profiling tools that Visual Studio's debugger gives you. As you may have guessed from some of my previous posts, every so often I get to worry about the performance of .Net code at work – but it's useful for any sort of project, not just Sitecore. And investigating some issues in my own code, memory snapshots and deltas helped me out again. So maybe they could help you too?
When you run a process with debugging (or attach the debugger) Visual Studio throws up two information panes:
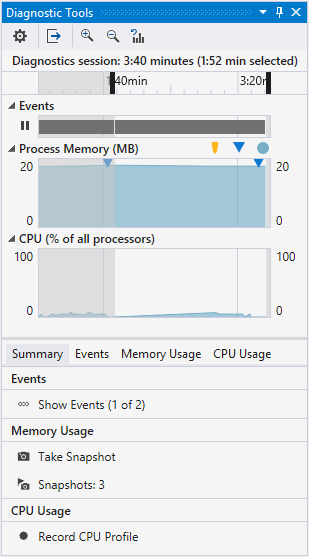
The top part describes the overall memory and CPU usage in some nice animated graphs. The memory graph here can be quite useful in itself, as it shows you trends in your code's memory use as it runs. The rate of change of this graph tells you about the overall rate of change in your app's memory usage. You're aiming for a graph that's roughly level over time.
But it's the bottom panel here that I'm interested in. There's a tab here for "Memory Usage" and a couple of helpful links on the summary page:
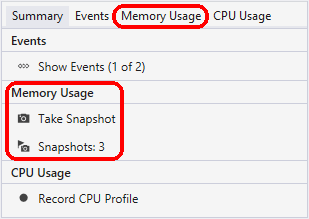
When you're debugging some code, the "Take Snapshot" option will grab you a memory dump of the current state of the .Net heap. You can take a series of these as your app works, to gather detailed data on how the memory usage is changing over time.
After you gather some dumps, the "Memory Usage" tab will show you some summary stats:
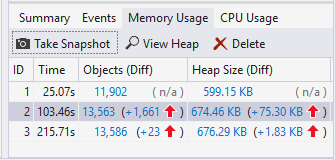
This tab gives some stats on the time the snapshot was taken at, the number of objects and the memory they were using. When you have more than one snapshot recorded, the second and onwards ones will have both the absolute numbers and a delta from the previous snapshot.
The various numbers here are blue, because the're actually hyperlinks to detailed reports. If you click the absolute numbers you get an absolute report, and if you click the delta then you get a report that shows you what changed between the two snapshots:
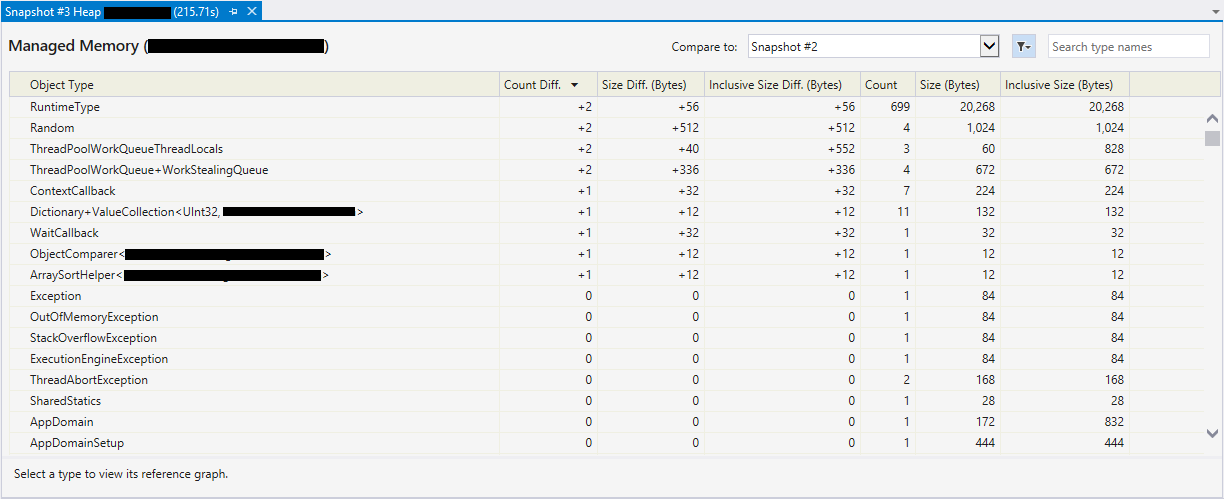
When you sort these tables with "most objects" or "most memory used" at the top, you get a detailed picture of what objects in your code are taking up the most memory resources. If types you defined, or framework objects that were allocated by your code are up at the top of these lists then you should start thinking about whether there's some optimisiation required to avoid problems in production. Does the code create and destroy lots of objects? Maybe pooling could help you reduce the problem? Or if objects are being created and never destroyed you need to look into what reference is keeping it in memory, because the .Net Garbage Collector won't dispose of objects that your code still has a reference to.
So next time you're working on some code that's taking up a surprising amount of memory on production, why don't you try making use of some snapshots to try and help you diagnose what it is that's filling up the memory?
Also, I find it helpful to check code with these tools before committing it in the first place. Because it's way cheaper and simpler to find and fix problems before they ever make it off your development machine...
↑ Back to top