
Jeremy Davis
Sitecore, C# and web development
I find myself doing quite a lot of work on performance for Sitecore websites at the moment. Whenever I do a similar job for a group of clients, I start to spot patterns in the sites I'm working on – and it struck me that there are some common performance issues that can be spotted just from the overview graphs you see when you collect trace data.
So to try and help you all improve the sites you ship, here are three that I've come across in a few projects recently:
 url copied!

What do you see:
Wide, mostly solid rectangles on the CPU-time graph for your threads. Sometimes all the requests look similar, and sometimes you'll see some short ones and some long ones.
Why does it look like this?
Simply put, you're working the CPU hard when a request looks like this. There are lots of potential reasons for this, but some common scenarios are:
var results = Sitecore.Context.Item
                .Axes("//*")
                .Where(i => i.TemplateID == requiredTemplateID);
because it's a classic performance bottleneck – it can fetch a lot of items from the database (which is itself a problem due to query time and cache churn) but then it filters them in memory, using up lots more CPU time and discarding a chunk of the data that Sitecore worked hard to fetch.
What should you do about it?
Use your profiling tool to look at what bits of code consume most CPU time, and use that information to optimise your code where you can.
Try to push effort off to the database server for data queries by including the best filter clauses you can into the query. Where possible, reduce the scope of API queries to reduce the numbers of items to process. Try to make best use of both Sitecore's data and HTML caches to reduce the CPU effort involved in rendering your pages. And maybe you could replace a big API query with a ContentSearch query instead? Or make use of custom fields in your search index to pre-compute (at index time) that complex lookup you need, and just index the answer?
url copied!
What do you see:
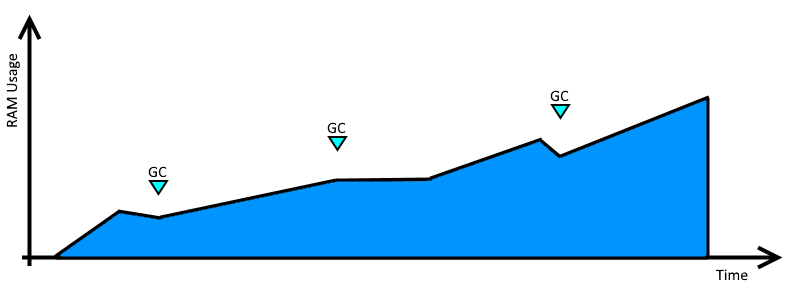
The graph of memory in use over time rises as long as the app keeps running. Garbage collection cycles may cause a brief drop, but overall the upward trend continues as the app runs.
Why does it look like this?
The .Net runtime's Garbage Collector is good, but there are still ways for your app to leak (or appear to leak) memory. Something going on in your code is preventing the GC from taking back control of some of the memory you're using. In desktop applications this can be kind-of normal (If you keep adding more text and images to a Word document, Word has to keep asking for more memory...), but for web applications it's less common for that sort of state data to stick around in memory between requests. Some common scenarios that might lead to high memory usage are:
Dispose()
at an appropriate point, these objects can hang on to memory until the .Net runtime gets around to calling their finaliser method. You don't know how long it will be before that happens, so even if they're no longer held in memory by references, their heap space can still be occupied.
What should you do about it?
You can use your trace tool's memory usage recording to look and see what objects are causing the heap size to grow. Try and work out why the GC cannot release or compact them. Look for statics and the allocation of really big chunks of data, and try to refactor your code to reduce these issues. Look for objects that implement
IDisposable
and make sure they're
implemented
and
used
correctly.
Most memory profiling tools (including Microsoft's) have ways to help you find both how the number objects change over time, and why particular objects are staying in memory.
url copied!

What do you see:
The CPU-time trace for your request has a definite
castle-crenelations
look to it, where the thread goes from busy to quiet to busy again while it answers a single http request. This might be many short cycles, or fewer longer cycles.
Why does it look like this?
This is usually down to threads waiting for locks or for some sort of IO operation. Locks might be accesses to thread-safe collections, or use of
lock(){}
blocks in your code. Waiting for IO will most likely be calls to blocking methods like
Read()
or async code which explicitly calls
Await()
to block until something completes.
What should you do about it?
If your code includes locks, you'll need to consider if it's possible to refactor to remove or reduce the scope of these operations. Ideally, avoid code which needs to explicitly lock anything. If you have to have
lock(){}
blocks, try to ensure they wrap the smallest (and fastest) section code you possibly can. You should also be very careful of any code which needs to lock two things - this is classic "deadlock" territory, and they can be really hard to debug...
Where you're dealing with IO, the ideal scenario is to allow is to get rid of the need to block entirely. If you can refactor your code to allow operations to complete asynchronously in parallel with other operation then this is probably the best bet. C#'s
async
features can be very helpful for this. Otherwise, consider if you can reduce the effort involved in reads and writes - can you reduce the number of small operations by doing one big one, to increase efficiency? Or is it possible to cache data in memory and reduce the amount of I/O you're doing overall?
url copied!