
Jeremy Davis
Sitecore, C# and web development
Recently I found myself looking at a Visual Studio project where the build was not behaving in the way I expected. So I was forced to try a few debugging techniques to work out what was up. And in the process of trying to resolve the problem, I discovered an interesting tool to help with scenarios like this. So if you find yourself stuck with a misbehaving MSBuild script here are a couple of ideas:
 url copied!
The scenario I had was a solution which included some custom
<Target/>
elements with
Condition
attributes. The aim was to have the build work differently when clicking "build" compared to clicking "publish" in Visual Studio. But when I was trying these things it was not behaving as expected. That meant I needed some ideas for debugging this situation, to help work out what was going wrong...
Two approaches helped me here:
url copied!
The simplest approach to diagnosing most things is to make use of some classic "just print it" debugging. If you have a target which has a condition attached:
<Target Name="Test" AfterTargets="ResolveReferences" Condition="$(MyVariable) == 'true'">
  ... do some stuff ...
</Target>
You can help show some code is running by including some
<Message/>
elements. These can print text in the output of the build, helping you visualise state. For example:
<Target Name="Test" AfterTargets="ResolveReferences" Condition="$(MyVariable) == 'true'">
  <Message Text="!!!!! Running Target Test !!!!!" Importance="High"/>
  ... do some stuff ...
</Target>
The
Importance
attribute here helps control when the message is shown in the build output, both on the command line and in Visual Studio. Setting it to
High
ensures the message is visible in a standard VS build, which is usually helpful for diagnosing issues.
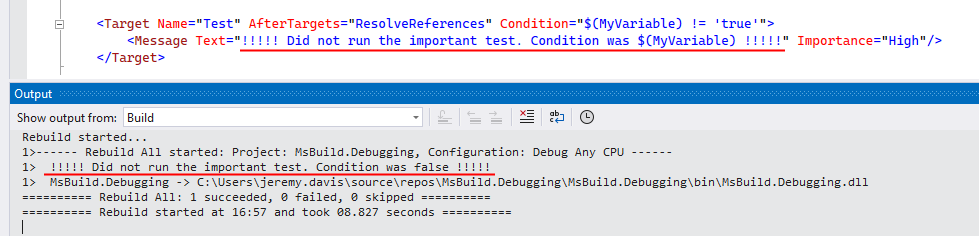
Sometimes it's also helpful to create "inverse-targets" to show when something doesn't run. It can be clearer to look for a message saying "this didn't happen" rather than looking for the absence of a message saying it did:
<Target Name="Test" AfterTargets="ResolveReferences" Condition="$(MyVariable) != 'true'">
  <Message Text="!!!!! Did not run the important test. Condition was $(MyVariable) !!!!!" Importance="High"/>
</Target>
As you can probably gues from the message above, MSBuild will do variable replacement in the message text. That can help you judge the state of
It's useful to note that Visual Studio seems to cache settings and variables quite a lot. I find when debugging a build and I'm failing to see a variable change I've made in a debug message like this, restarting Visual Studio often helps. (Or debugging the build on the command line rather than in Visual Studio, if that's relevant to the problem)
But sometimes you want to dive deeper than just printing a bit of state. What if you want to see exactly what the build did?
url copied!
What's less well known is that MSBuild can do
very
detailed debug logging, which can be quite helpful in diagnosing problems where a bit of bonus
WriteLine
doesn't really cut it.
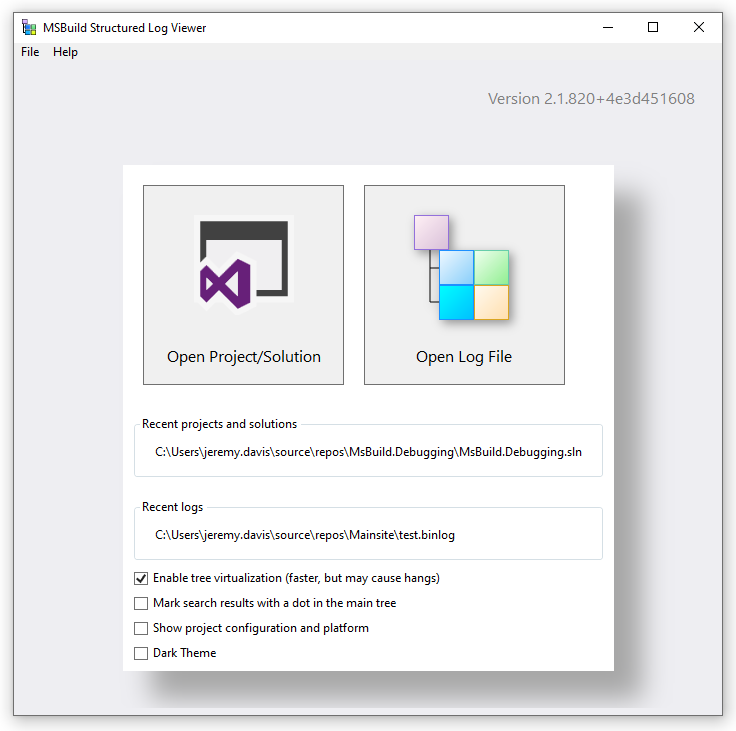
There's a special tool you need here, which is able to load and display these special logs, as they're stored in a binary format for efficiency. You can get this from https://msbuildlog.com/. When you install and run that you get a dialog that lets you pick a log file or a project to examine:
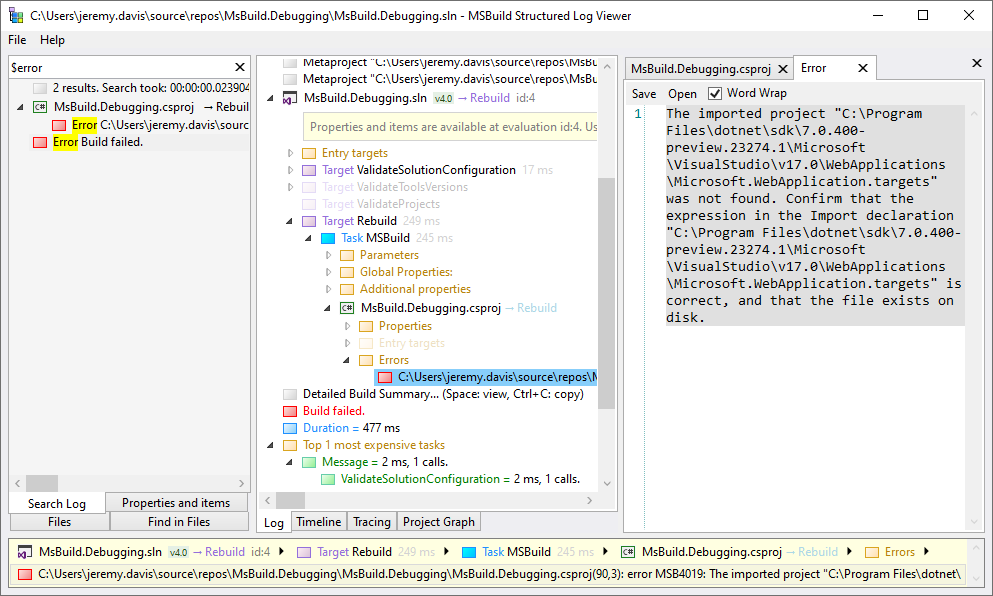
If you load your solution file this tool will run MSBuild for you, grab these special logs and display them in an interactive form. And it logs everything that happens over the course of the run:
But you can also manually record the logs when you run a build and then open the files rather than the solution. So with a bit of effort, you can record this detailed log data from cloud builds run by Azure DevOps if you wish.
There are two ways to do that. For an individual command-line build you can add
-bl:<filename>.binlog
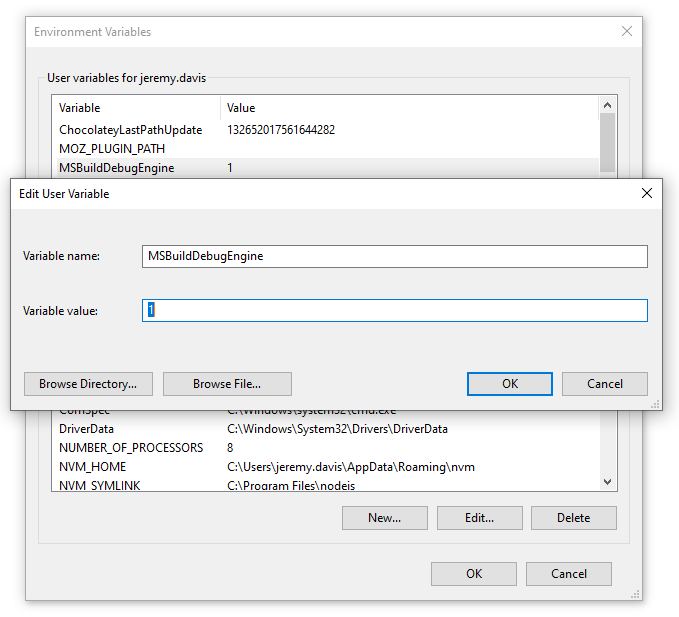
when you run MSBuild. But if you want to capture from Visual Studio, or a place where you can't easily change the command for the build then you can set an environment variable which tells MSBuild to record this bonus data whenever it runs. You need to set
MSBuildDebugEngine
to
1
in that scenario. You can do that at the command line with
SET
or
$env
depending on whether you're using
cmd.exe
or PowerShell for your console. That's helpful in a scenario where you're running MSBuild directly. Or you can use the "Advanced System Settings" dialog to edit Environment Variables for your machine if you're trying to capture data from Visual Studio's execution of MSBuild:
When that's set, and you restart Visual Studio so it notices, the build process generates a new folder in your project or solution:
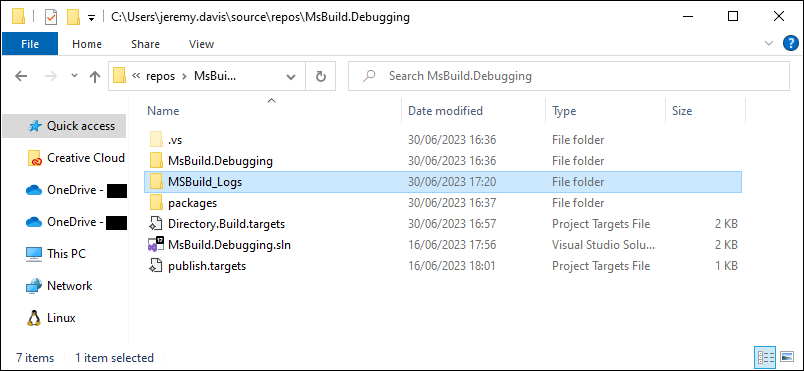
And that fills up with data files which log loads of data from your builds:
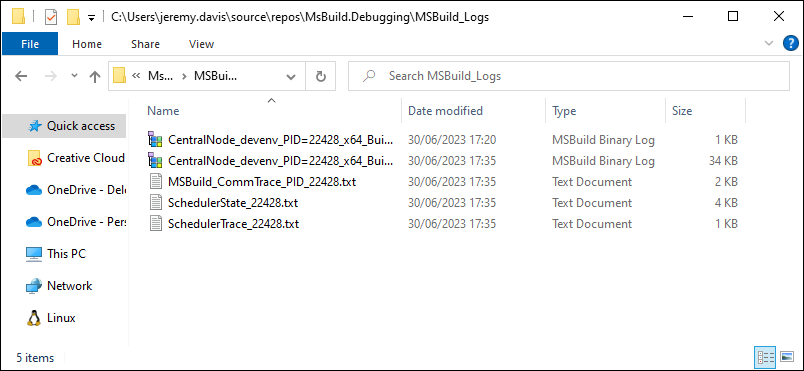
The "MSBuild Binary Log" files are the interesting ones here.
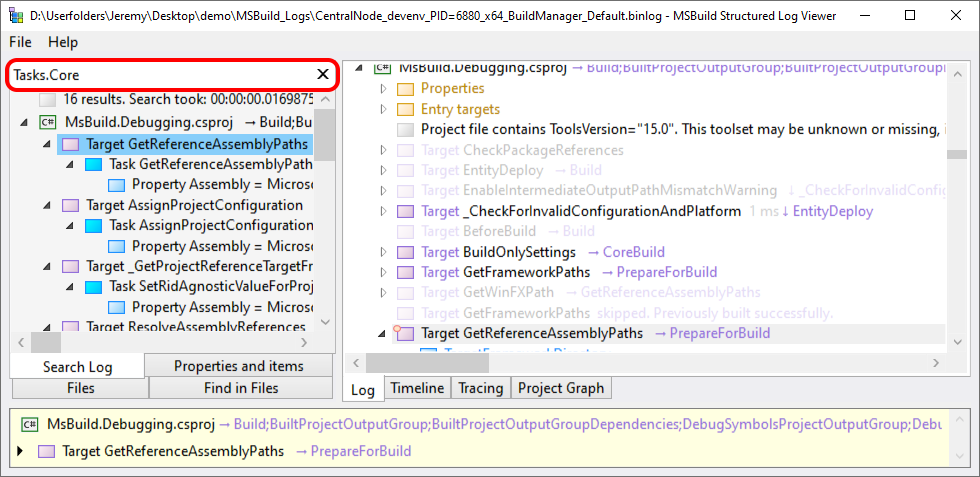
Whichever way you capture it, what you get is a great deal of detail about what happened during your build. It's recording debug logging for pretty much everything which happens under the surface. Including flags and variables, which operations occurred and status or error values which occurred as a result.
You get to see all the internal details, and follow the flow from start to finish. So if you're confused as to why a build is behaving in a certain way, the answer will be in this UI somewhere.
There's also a search tool. That's really helpful for homing in on the specific variables or steps you're interested in, since there's usually a lot of data:
And there is timing data recorded, if your interest is more in the speed of your build and what steps are slowing you down:
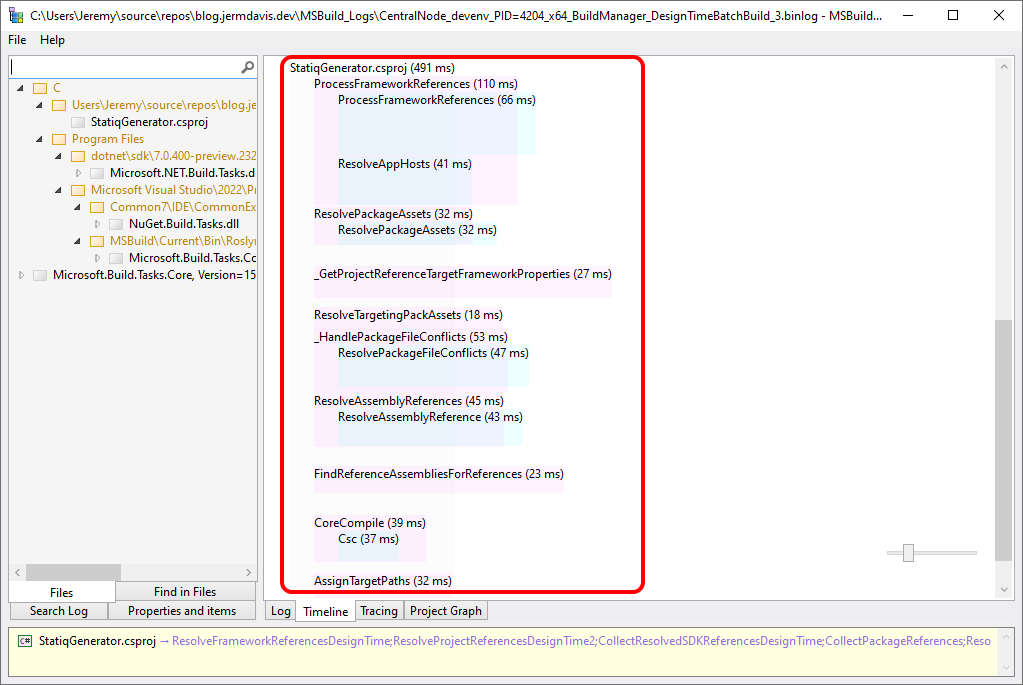
All the blocks in the timing diagrams are hyperlinked back to the relevent sections in the log detail, so you can easily click through to find the data about what a specific step was doing straight from the timing diagrams.
This tool is open source, and the GitHub repo for it includes helpful documentation in the wiki, as well as more info on how to use it.
So if you've got a very tricky issue with MSBuild not doing what you expected, maybe this can be of help?
After I posted this, Nik Mitikov made an interesting comment on LinkedIn:↑ Back to topAlmost-illegal hack I use is to place a dummy/empty task with 'System.Diagnostics.Debugger.Launch()' code in execute method. Once runtime runs to the code, it will ask for a debugger to attach and you are debugging MSBuild = access to anything you need ;)
It takes a little more effort to organise a build task that does this - but it could be a very powerful tool in some circumstances. It's another useful trick to keep in your toolbox... ...