
Jeremy Davis
Sitecore, C# and web development
I've written a few things about diagnosing memory issues in Sitecore over the years, but one topic I've not covered in detail is anything around "how to spot when it's not piles of your own objects that's causing the issue". Problems like leaking handles can have an obvious link back to the custom code that you can spot fairly easily in diagnostic data. But not all memory issues do. I was discussing a possible example of this with a colleague recently, and it seemed like another thing to write down...
 url copied!
Say you have a website which is running, but it has a rising memory graph over time. And eventually it hits the IIS configured limit for worker process memory and gets recycled. And when you follow the "look into the details of memory usage" process discussed in my previous post you don't see any of the project's objects at the top of "how many objects are in memory" list:
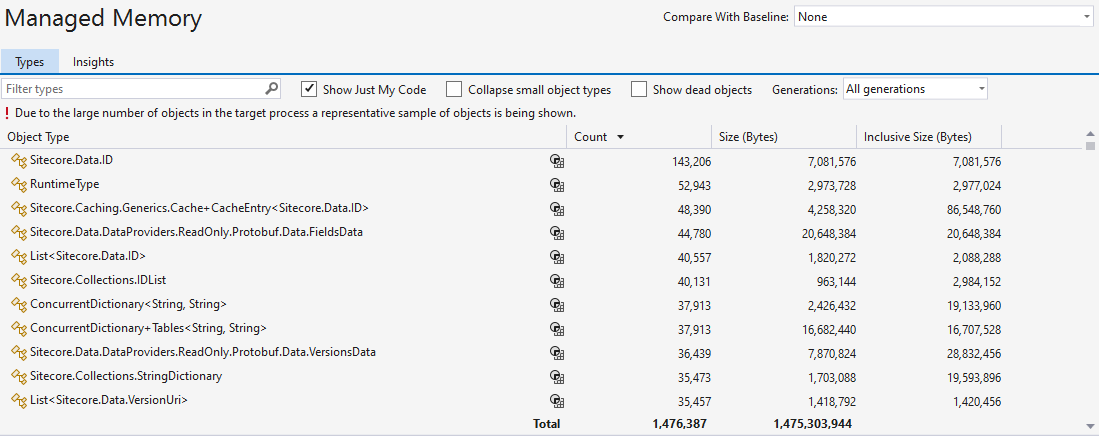
What could be going on if the site is managing to run out of RAM without a big pile of our objects?
url copied!
The first thing that's really helpful when looking at this is making sure you're looking at a delta view between two memory dumps. I've mentioned this in previous posts, but you can:
As soon as you add a baseline, the UI changes to show deltas for many columns:
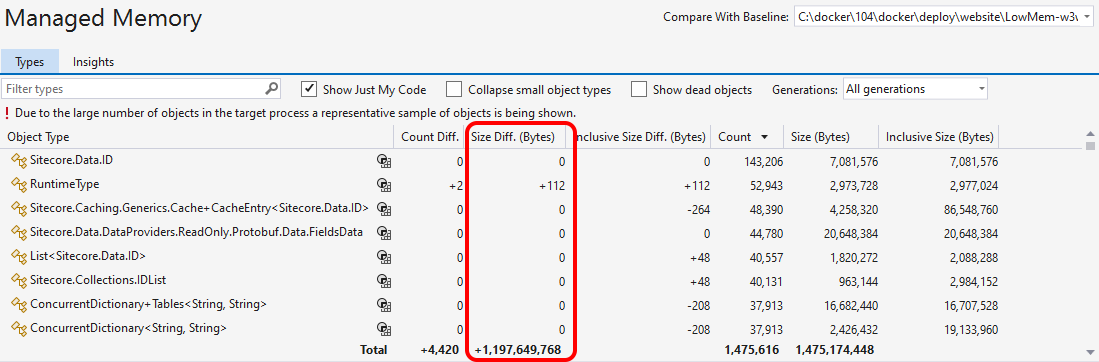
And in this contrived example, you can see the "Size Diff. (bytes)" column shows a +1GB change (in the totals row along the bottom) between two memory dumps. That's good evidence you're looking in the right place, as it's reflecting exactly the sort of issue which might cause the process to cycle.
So sorting that view by object count - which is the difference between counts in the two memory dumps here - gives some interesting results:
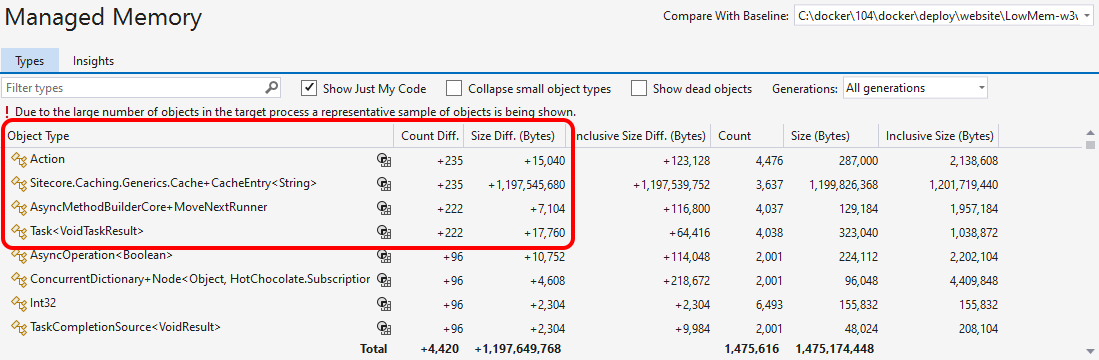
What does this tell us? Well there's a useful clue here - we can see a number of types were we've had a change of 200-odd more objects in memory. But most of them occupy a relatively small amount of memory. Except for one - which seems to be using a (deliberately exagerated) amount of RAM. That type is Sitecore's
CacheEntry<>
object. And that gives us a very significant clue for a common issue in this scenario: It can be Sitecore's cache tipping IIS over its memory boundary.
So how can we work out what might be going wrong here?
url copied!
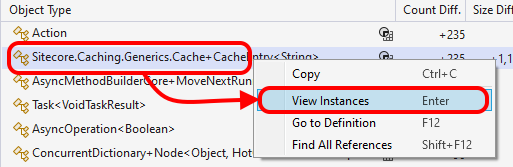
If stuff is in the cache, can we look at what is there? Well yes - we can have a poke around inside the memory being shown in the diagnostic data. First up, right-click the offending cache object in the list, and select "View Instances":
And if you right-click items from that view, you get a "Quick Watch" option:
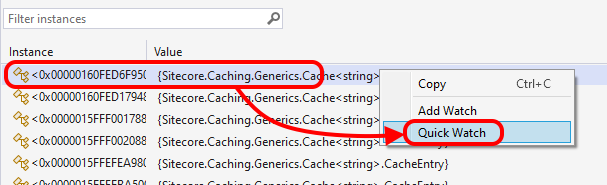
And selecting that will allow you to poke about inside the object:
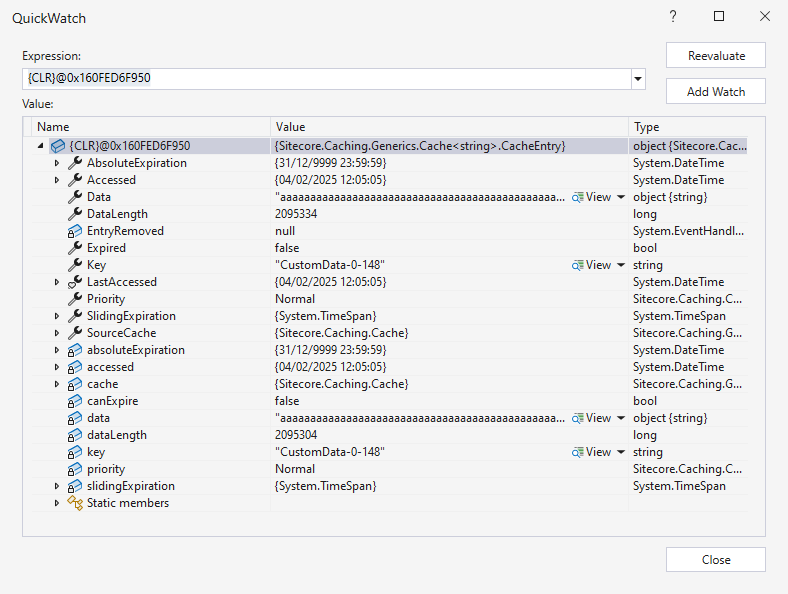
And this gives a couple of interesting clues. Firstly we can expand the
SourceCache
field to see which internal cache this object is in:
![The SourceCache field expanded in the Quick Watch window - showing this data is in the 'website[html]' cache](/img/2025/03-ItsTheWebHtmlCache.png)
And in this case it's the
website[html]
cache - which is where renderings and similar get their output HTML recorded, and where any custom code using
Sitecore.Context.Site.SiteInfo.HtmlCache.SetHtml()
to record data will be filing stuff.
You can generally spot the difference between the custom caching and Sitecore's own by looking at a couple of fields:
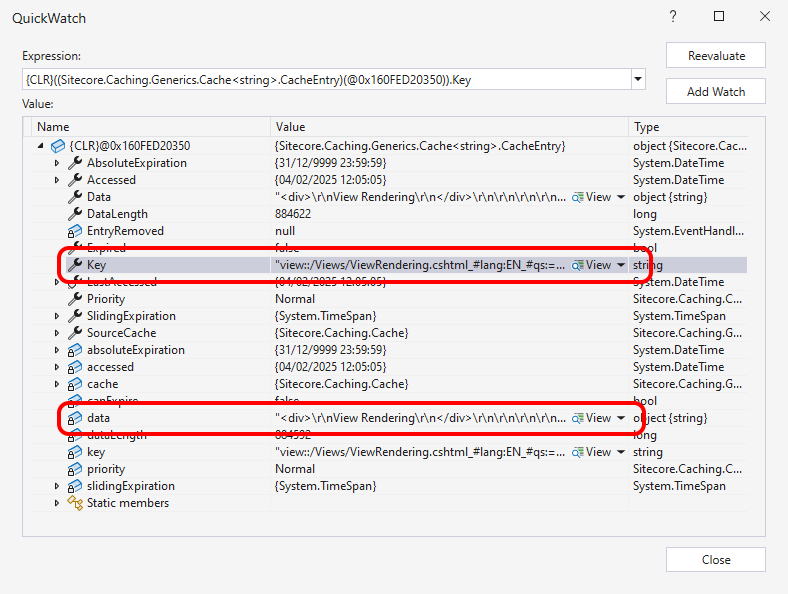
The key is (pun intended) the
Key
field - the structure of the cache keys for Sitecore's data is fairly easy spot, as it will show the rendering and other parameters. You may also get some info from the
Data
field - showing HTML here.
url copied!
So the diagnostics have given us a big clue here. But you can get some other useful info out of Sitecore. Out of the box there's a
/admin/cache.aspx
debug page available on the Content Management role, which allows you to see and clear data in caches. But in years gone by assorted people have tried improving that file.
My go-to in this scenario is a version I tweaked from Brian Pedersen's version. This lets you view the set of caches, clear them individually, and drill in to see their data more easily - and it's been updated to work on the recent versions of XP. (Works on 10.4 at the time of writing)
Don't slap this onto a production server without authentication or firewalls (etc) in place, as this isn't data you want anyone on the internet to see. But the tool is a single
.aspx
file so it is easy to deploy in a scenario where you want to look into data on a running system. And it can give you useful visual feedback when something isn't right:
![The extended cache view tool, showing it's view of the web[html] cache from when the memory dumps discussed earlier were taken. It shows 2.2GB of memory in use by this cache - out of a max 2.4GB allowed. This is highlighted by a red graph bar](/img/2025/03-CacheToolInTheRed.png)
That red "a cache is getting full" bar, combined with the large current / max size info to the left of can be a couple of clues to the issue.
url copied!
If you find yourself seeing behaviour similar to what's described above, then there are some common causes I've dealt with over the years. Maybe one of this might be an issue for you:
Did cache limits get disabled? It's pretty easy to disable cache size limits across the board. Sitecore even provide an example patch file for it. But this isn't a good thing to do on production. If your site has enough data, caches can easily grow bigger than the available RAM of your instance, and IIS will cycle the site.
Are cache limits just to big? Relatedly, you might have cache limits defined explicitly in a config patch - but for some reason they are now too big for the server in question. That might just be because they are too large for the machine's available RAM. Or they might have been ok in the past, but over time memory pressure from other sources means they're now bigger than you should have.
Are you caching too much stuff? Things I've seen push caches (especially the HTML one) over the edge before are the "vary by querystring" or "vary by user" options. In the right scenario these can be useful - but potentially they can lead to a great deal of different data being cached. If your HTML cache ends up with millions of variations of some things, you might want to reconsider exactly what caching options you've selected for your renderings. Maybe you really need some custom cache for data used to generate each user's version of a control, rather than caching every rendered variation of the control?
Is custom caching storing
big
stuff?
Sitecore's
Sitecore.Context.Site.SiteInfo.HtmlCache.GetHtml()
and
SetHtml()
methods
can be very useful
in some scenarios - but what are you throwing into that cache? Big objects can cause problems - so take care with what gets stored.
But overall, the best advice with most of these problems is to measure and analyse real production data - that's where you'll be able to validate if the assumptions your code and config make are sensible.
↑ Back to top