
Jeremy Davis
Sitecore, C# and web development
Some time back I did a load of work on performance diagnostic work on some poorly performing Sitecore websites. (Which was the basis of a talk I gave a few times) I've recently had to look at some similar issues - but the world has moved on. I now have Visual Studio 2022 as my diagnostic tool of choice, and the websites are commonly hosted in Azure PaaS web apps. So what do you have to do these days to diagnose likely places for your code to be stuck?
 url copied!
Broadly, when you're looking at a slow or unresponsive server where there are not obvious issues like "the database is overloaded with requests" or "the logs are full of exceptions", a good tactic for working out why is to get a process dump of the server and investigate it to find out what the code is doing. You can't directly attach your debugger to a production website, because debuggers stop threads from running - which would disrupt a production site. But you can save the state of a production server and analyse it locally, without causing that side-effect.
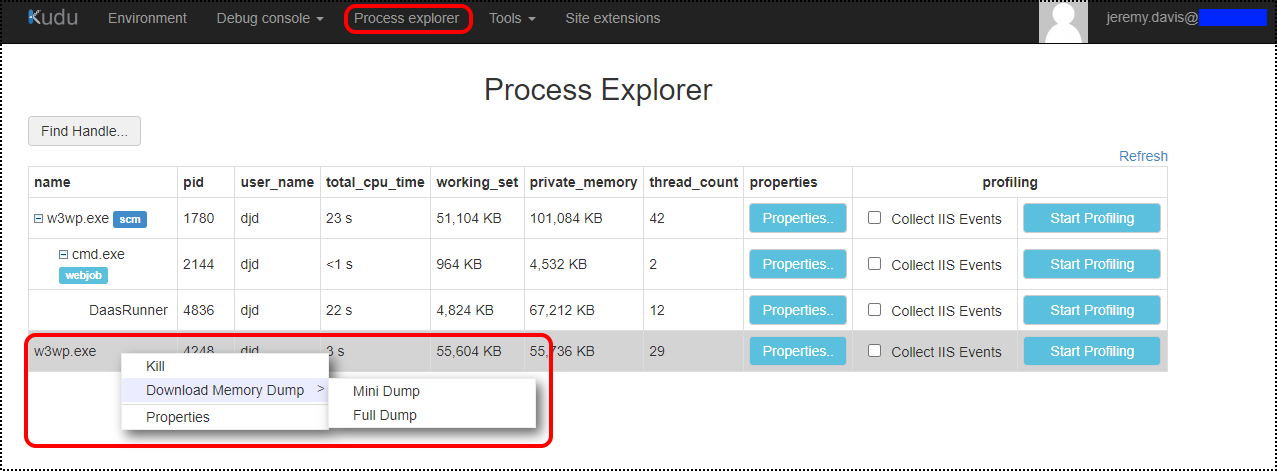
You can manually trigger process dumps in Azure. As well as the command-line tools available, you can launch the "Advanced Tools" page, click "Process explorer" and right-click the correct process:
But if you're dealing with occasional slow-downs or crashes that's not always very helpful. You don't want to have to sit and watch the website all the time until it breaks - what you want is for the website to dump itself if some useful metric goes out of the range you want. That lets you go do something else helpful while it gathers data for you.
And Azure has you covereded here...
There are a few requirements for how you set up your site for this though. Firstly you have to ensure that your App Service Plan is using one of the "production ready" service levels:
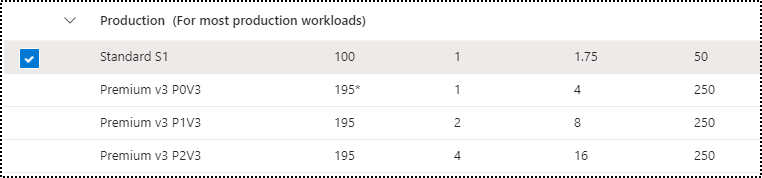
Anything above an S1 should work here.
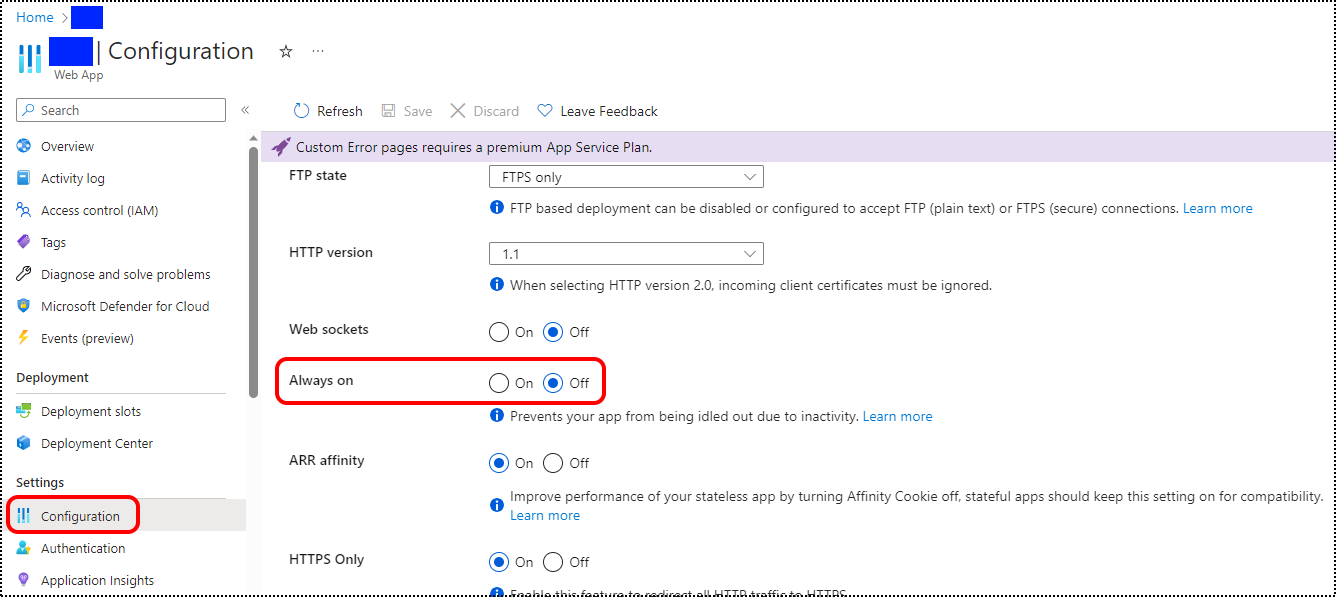
Secondly you need to ensure that your app is configured to be "always on" so that it's not dumped out of memory for inactivity. That's set up in the "Configuration" section of your App Service, on the "General Settings" tab:
And you also need to ensure you have a Storage Account available to record this data into.
url copied!
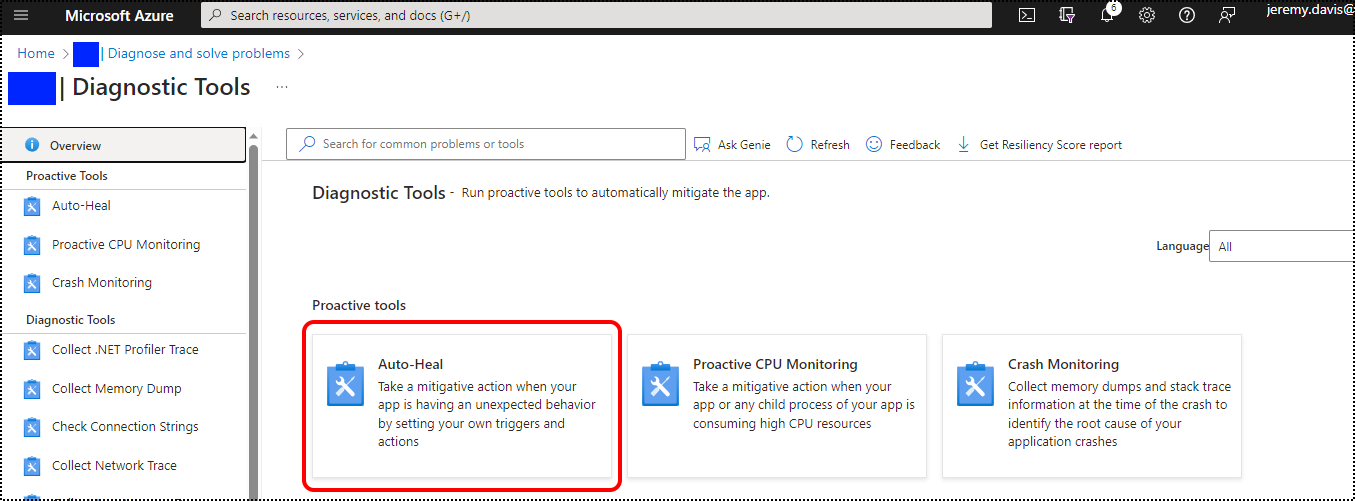
If you go to the "Diagnose and solve problems" section of your App Service there's a tile for "Diagnostic tools":

Clicking that gets you a menu of a load of diagnostic options. And "Auto Heal" hides the relevant options here:
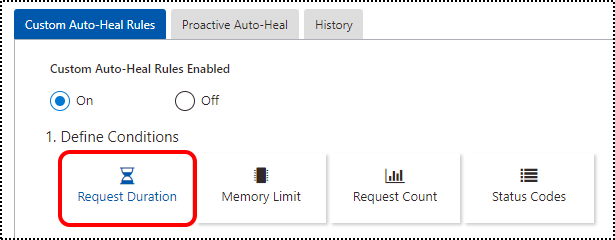
Auto-heal covers a variety of things relating to restarting your app if stuff goes wrong, but you also have the option to dump state when this happens. You want to create a "Custom Auto-Heal" rule, and triggering it on "Request Duration" was the right choice for my situation - where every so often requests would slow down and start taking many seconds rather than milliseconds:
When you click that, you need to add a new "Slow Request" rule:
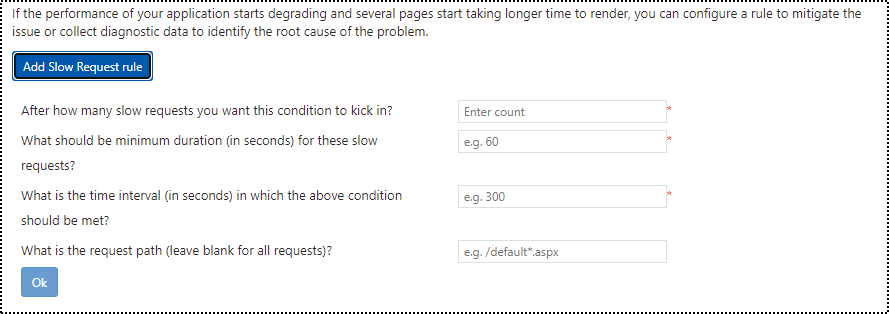
There are a few questions to deal with here. First is "how many requests need to break the rule before a something happens". Depending on how critical your problem is you'll likely want to make this smaller, so you get an action sooner. The second question here is how long does a request need to take for the rule to kick in. You'll likely have some metrics that tell you when a request is "bad" for your site, and things have gone badly wrong. Depending on what you do with the recycle options later, you may want to set this for a "my site is basically broken now" timescale, rather than "the request took a bit too long". The third question is how long is the time window for the bad request criteria to be met. Remember that this needs to be a minimum of "the number of rule breaking requests multiplied by the time a request has to take" in order to work. And finally you can add a path filter here if you want, if you need the bad request to be a certain page.
With that configured and "Ok" clicked, you need to pick an action to trigger when the conditions above fail:

Collecting a memory dump requires a "Custom Action" and whe you select that you need to choose what happens when the dump is triggered. For "the site is broken" situations Microsoft recommed the "CollectKillAnalyze" option which will generate the dump and recycle the app. Depending on your underlying problem that might fix your issue (for a while) but in certain situations (say app startup hammers your database server) it could be a bad thing. And you're doing this on production - so you need to think about this one for your site and your issues.
You also need to provide details of your storage account here, to give it somewhere to save the data. With that done, you can save this step.
Finally, you need to save your overall settings. It's worth paying attention to the messages here:
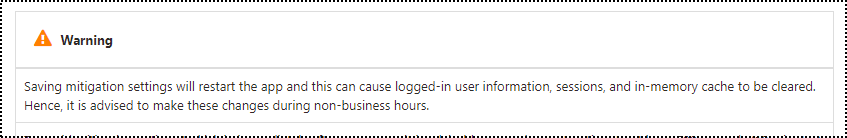
Saving these settings recycles your app. So you probably don't want to do this when the site's under load. Ask me how I know...
But once that's saved, you can sit back and wait until something goes wrong.
url copied!
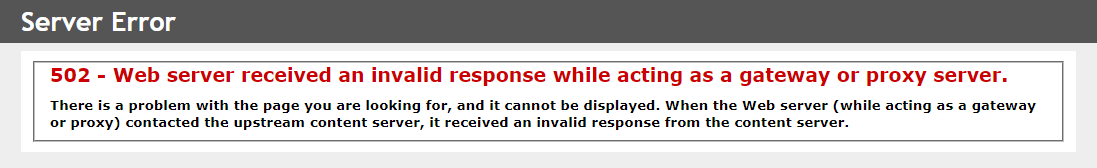
When the rule triggers two things will happen. Firstly (if you chose "CollectKillAnalzyse" above) your site will recycle and users may see errors. When I test this (on a site with no custom error pages) I see:
And the second thing is that you'll find a new container in your storage account called "memorydumps". Under that there will be a folders under that for your website's DNS name, the date/time the dump was triggered and then the Azure instance id. And in there will be a ".dmp" file.
You'll want to download that. Load your code solution and then use "File / Open" in Visual Studio to load the dump file as well. That gets you a big screen of information, and some options for how to continue:
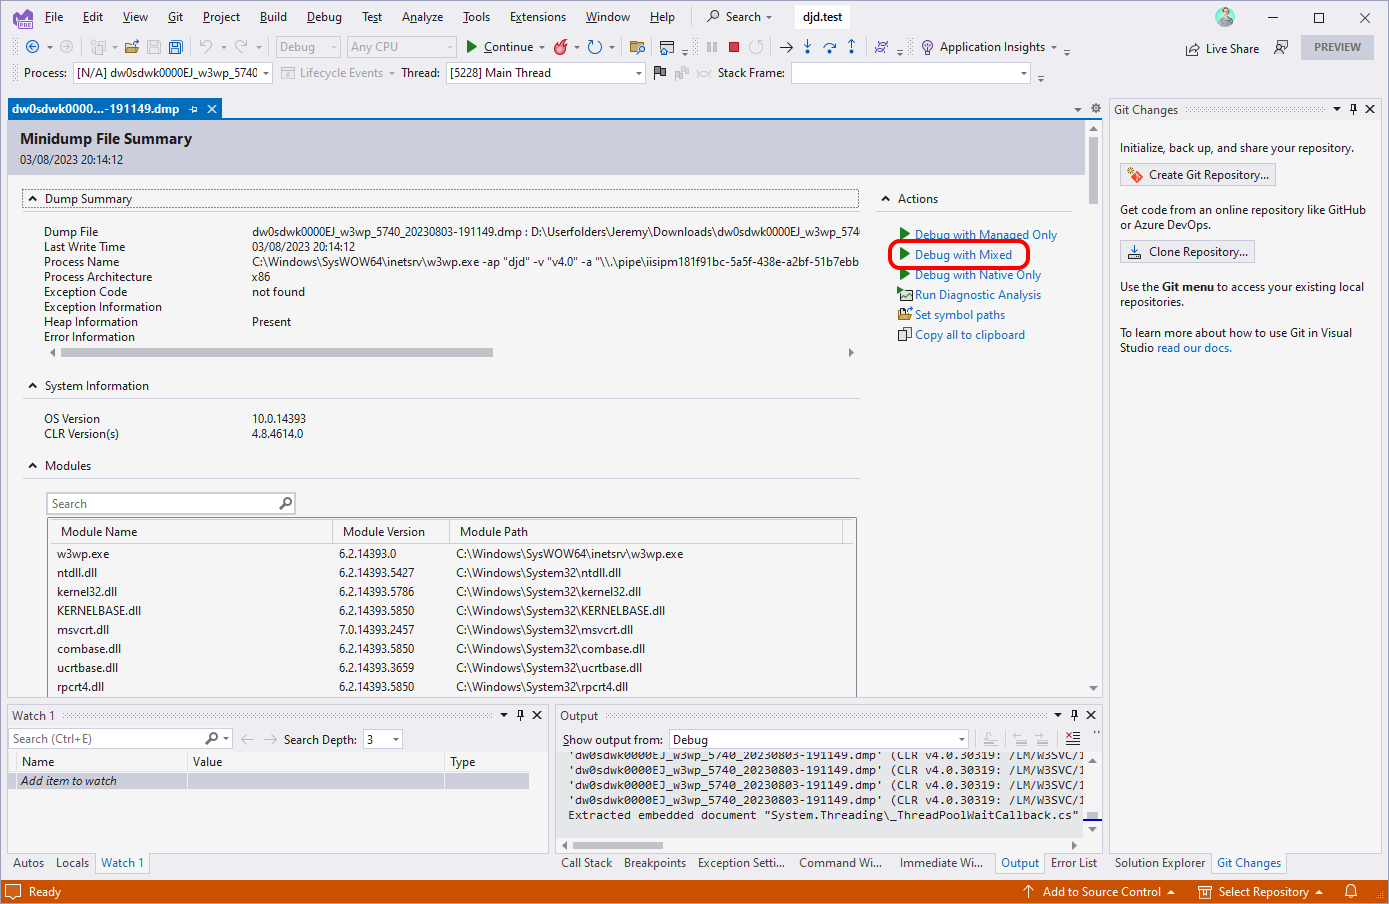
I've had best results clicking teh "Debug with mixed" option. That will fire up a debugger capable of looking at both managed code (your .Net app) and native code (Windows itself). It often takes quite a while to load all the symbols for this, but tells you the most about what's up.
From there, find (or open) the "Call Stack" window, and click the "View all threads" option:
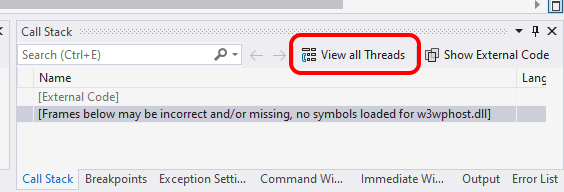
That will open up the "Parallel threads" window, which gives you a big tree diagram of the running threads in the dump. There's probably a load of noise here, so disabling "Show External Code" via the button a the top of this window can help it be more readable. And from there you can search for call-stack entries that are part of your codebase:

The number of threads here will likely vary with how many request your server was handling. Some are irrelevant, because they're not part of the websiite. But threads that include your code are the ones which are part of your website, and probably the ones you care about.
From here I tend to right-click the line(s) for the project's code, and select "Go to source code" so I can see what part fo my app is the culprit. If that points you at something like a nastly looking Sitecore data API query then good times, you have a pretty good clue as to what's up. If not you may find that re-enabling "Show External Code" helps. That may give further clues about what's up.
↑ Back to top