
Jeremy Davis
Sitecore, C# and web development
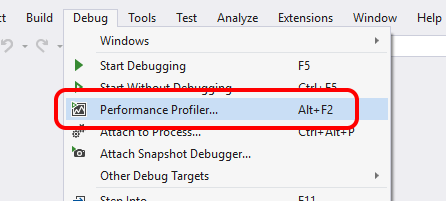
I've been using VS2019 for all my personal development work pretty much since the first preview came out. For general coding and debugging it's been good so far – stable, and effective. And little things like git stash control from the UI make me happy... It got its full release recently, just before I spoke at SUGCON 2019 – where I said I'd blog something about how 2019 changed the performance measurement stuff that I was presenting. Having done some tests in the last few days, it's not looking so shiny any more...
 url copied!
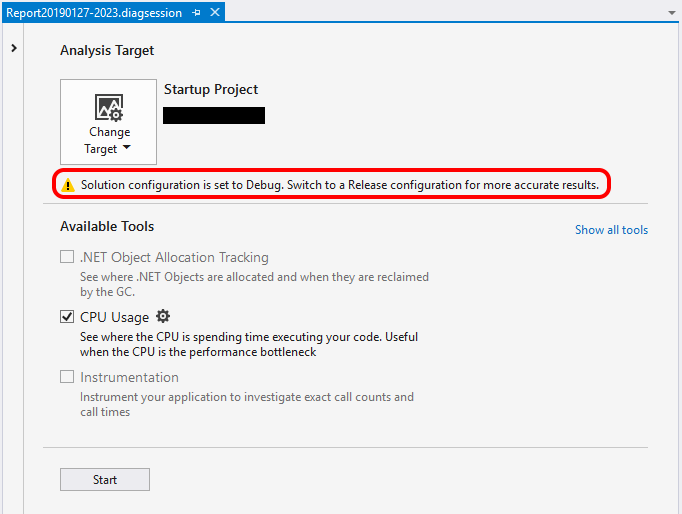
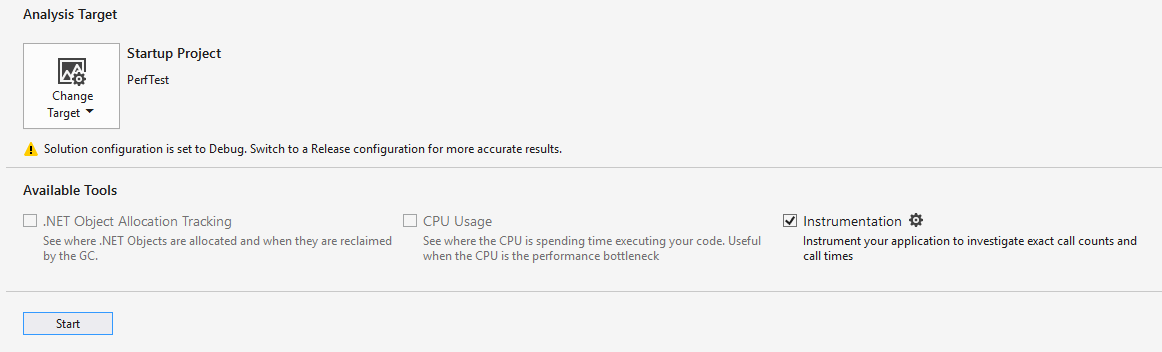
That gives options for selecting what to monitor and what sort of measuring to do. Plus it also helpfully tells you when you're about to try to profile code in debug mode:
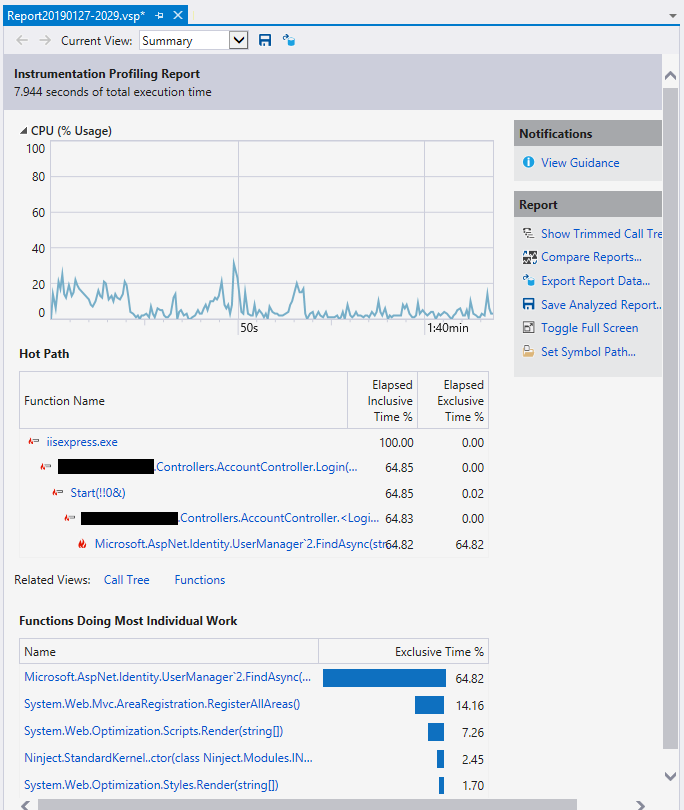
If you're looking to profile an app being built and started by Visual Studio, or a website that can run under its local website hosting and debugging then all looks good. You can get profiling that looks and behaves much the same as in VS2017. My favourite "Modules" view for detailed profiling is still there, as you can choose to generate an "instrumentation profiling" report:
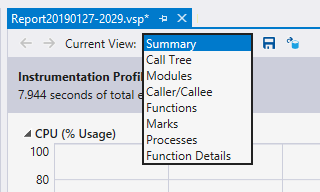
and pick the Modules view from the "Current View" dropdown at the top of the report page:
But once you start trying to profile Sitecore, thats where things start to go wrong...
url copied!
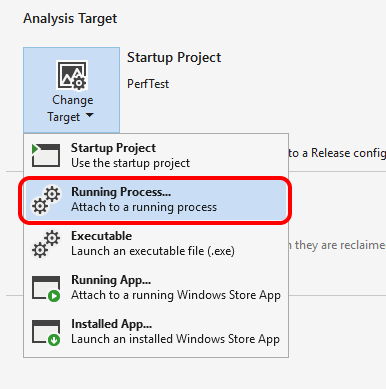
When I use the UI above, I can choose "Change Target" to select a running process:
But when I do that I have two issues. Firstly, the dialog for picking the process doesn't give enough information to easily pick the right process:
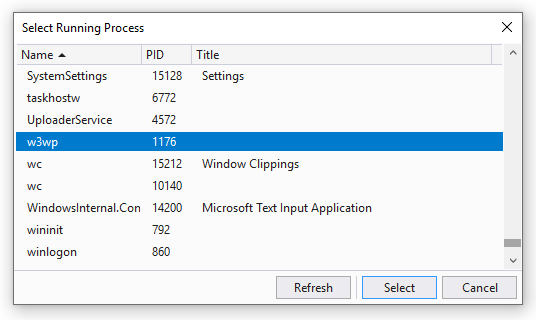
It doesn't show the App Pool identity – which makes picking out the Sitecore process from the xConnect / Identity Service one (or any other website) difficult. I needed to use another mechanism to find the right process ID. (I looked at the "Debug / Attach to Process" dialog – which still shows that data) But having done that, when I pick the process I wanted, I found another issue:
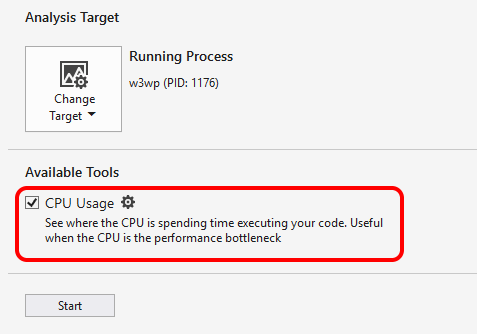
It removes all the options other than "CPU profiling". You can no longer pick Instrumentation, or any of the other types – and that means you get much less useful data. When I try it against a simple plain ASP.Net MVC web app I get a report like this:
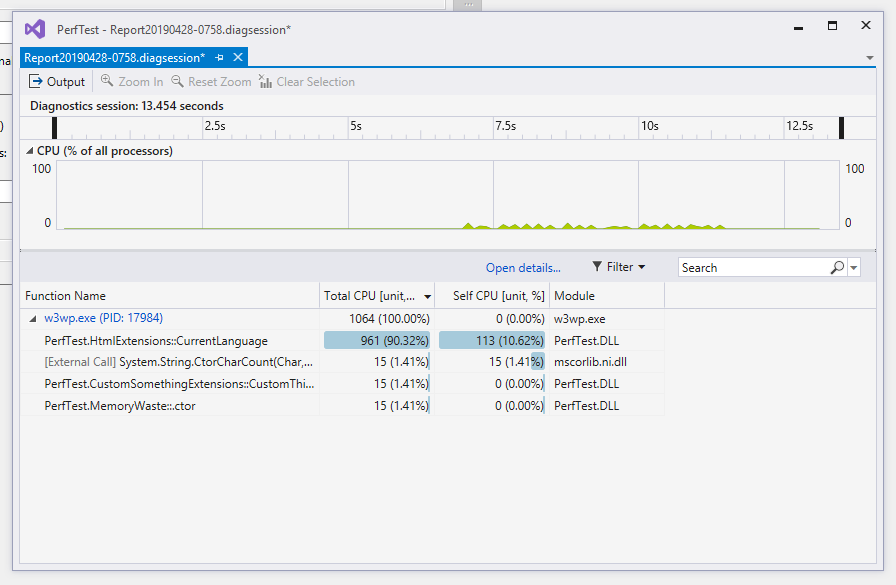
And when I tried it against a site running Sitecore with some View Renderings, I only got a couple of rows on this report.
So as an alternative I tried configuring my test project to start the IIS site rather attaching to the web server process. To be honest, I didn't think this was going to work, but it was worth trying:
You can now choose "Startup Project" from the diagnostic and profiling form now, and in turn that leaves the instrumentation profiling option enabled:
And the profiler will indeed start, show you your web app in a browser window and appear to gather data. But once I exercised my app and stopped the profiler again, I didn't get to see a report. Nothing seemed to happen. Looking at the output window, I was seeing something like:
Preparing web server for profiling.
Warning VSP2347: The monitor was unable to start the VS performance driver.  Windows cannot verify the digital signature for this file. A recent hardware or software change might have installed a file that is signed incorrectly or damaged, or that might be malicious software from an unknown source. Consider using the /Admin:Driver,Start and /Admin:Security options of VSPerfCmd from an elevated environment.  Performance counter data and detection of kernel mode execution is disabled.
Profiling started.
Instrumenting C:\Users\djdav\source\repos\PerfTest\PerfTest\\bin\PerfTest.dll in place
Info VSP3049: Small functions will be excluded from instrumentation.
Microsoft (R) VSInstr Post-Link Instrumentation 16.0.28713.1 x86
Analyzing component...
Instrumenting component...
##                   (5.56 %%)
###                  (11.11 %%)
####                 (16.67 %%)
#####                (22.22 %%)
######               (27.78 %%)
#######              (33.33 %%)
########             (38.89 %%)
#########            (44.44 %%)
###########          (50.00 %%)
############         (55.56 %%)
#############        (61.11 %%)
##############       (66.67 %%)
###############      (72.22 %%)
################     (77.78 %%)
#################    (83.33 %%)
##################   (88.89 %%)
###################  (94.44 %%)
#################### (100.00 %%)
Successfully instrumented file C:\Users\djdav\source\repos\PerfTest\PerfTest\\bin\PerfTest.dll.
Launching web server with profiling.
Launching profilable project.
Data written to C:\Users\djdav\AppData\Local\Temp\Report20190427-2230.vsp.
Profiling finished.
Profiling complete.
The "Windows cannot verify the digital signature for this file" error at the top seems odd. And the fact that it has applied instrumentation to the file in the project bin directory, not the process being attached isn't great. (Though I did make sure the latest binary, plus the extra pdb file that appears to have been generated for diagnostics got copied over to the IIS site's bin folder)
And, to cap it all, if I try to open the .vsp report file mentioned directly, I got:
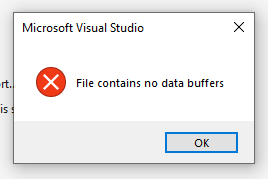
And no report window was opened. That set of messages and problems makes me suspect that this approach is not actually attaching the performance monitoring to the IIS process correctly – but my knowledge of how this all works under the surface isn't good enough to understand why right now.
(I've tried the command-line approach suggested by the messages above, and the switches mentioned, but they gave much the same error messages)
url copied!
But until I find an answer or a workaround to this, I'm going to stick with VS2017 when I need to do performance measurement. It may not have all the bells and whistles of the latest release, but I can make it profile Sitecore running in an IIS site – and that's what's key for me.
If anyone reading this knows what I'm doing wrong then let me know – I'd be happy to be able to replace this post with one describing how to do this correctly for Sitecore sites.
And meanwhile I'll try to find time send some feedback to Microsoft, to see if they can help me.
↑ Back to top