
Jeremy Davis
Sitecore, C# and web development
The approach I read on how to "how to attach your debugger to Sitecore inside Docker" by running
docker inspect
to fetch the current IP address, and pasting it into Visual Studio can be a bit of a faff. So I got to wondering: Are there other ways to achieve the same result?
Edited to add : With the release of Visual Studio 2019 v16.5.0 recently, this post is outdated now. This version updates the "attach debugger" dialog to include "attach to a docker container", along with UI for picking the right container. But I'll leave this here for anyone who can't upgrade, and for historical interest...
Well so far I've thought of two:
 url copied!
Adding a few config options to that, I ended up with something like:
param(
    [Parameter(Mandatory)]
    [string]$containerName,
    [string]$role = "cm",
    [string]$port = "4024"
)

$container = "$($containerName)_$($role)_1"
$network = "$($containerName)_default"

$json = . docker inspect $container
$obj = $json | ConvertFrom-Json

$ip = $obj.NetworkSettings.Networks.$network.IPAddress

$debugTarget = "$($ip):$($port)"
$debugTarget | Set-Clipboard
Write-Host "Debug target $($debugTarget) sent to clipboard..."
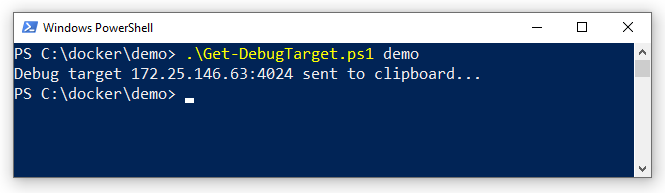
This assumes that you've kept the default name for Docker's network settings in your compose file – if you don't you'd need to change how the network name is worked out above. Then you can save that as "Get-DebugTarget.ps1" and you can pop up a PowerShell window, and run that against your container:
.\Get-DebugTarget.ps1 demo
and see:
And you can paste that straight into your Visual Studio "attach debugger" window:
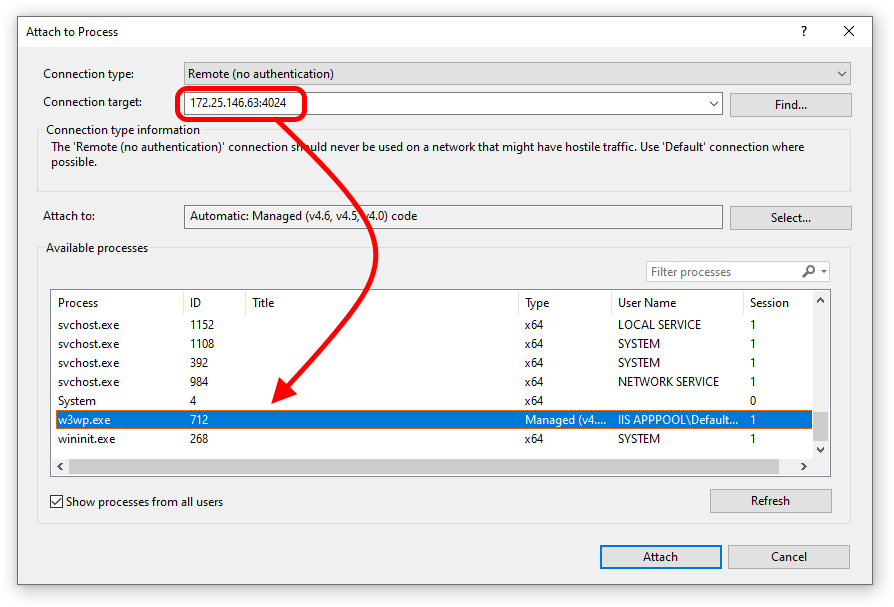
And attach to your web process. Bingo...
Note: I found I had to type a space after pasting into that dialog in VS2019, because otherwise it doesn't seem to recognise that you typed the text, and defaults to closing the dialog when I hit enter. I guess they didn't expect you to just paste into that field...
url copied!
Well, when you browse to your Sitecore website you're able to use
localhost. That's because the default compose file maps the IIS port inside your container to a specific port on your default network outside the container:
  cm:
    image: ${REGISTRY}sitecore-xp-spe-standalone:${SITECORE_VERSION}-windowsservercore-${WINDOWSSERVERCORE_VERSION}
    entrypoint: powershell.exe -Command "& C:\\tools\\entrypoints\\iis\\Development.ps1 -WatchDirectoryParameters @{ Path = 'C:\\src'; Destination = 'C:\\inetpub\\wwwroot'; ExcludeFiles = @(); }"
    volumes:
      - ${LICENSE_PATH}:C:\license
      - .\data\cm:C:\inetpub\wwwroot\App_Data\logs
      - .\code:C:\src
      - C:\Program Files (x86)\Microsoft Visual Studio\2019\Professional\Common7\IDE\Remote Debugger:C:\remote_debugger:ro
    ports:
      - "44001:80"
    links:
      - sql
      - solr
If we add the debug port to that mapping, then we could attach the debugger to localhost too:
  cm:
    image: ${REGISTRY}sitecore-xp-spe-standalone:${SITECORE_VERSION}-windowsservercore-${WINDOWSSERVERCORE_VERSION}
    entrypoint: powershell.exe -Command "& C:\\tools\\entrypoints\\iis\\Development.ps1 -WatchDirectoryParameters @{ Path = 'C:\\src'; Destination = 'C:\\inetpub\\wwwroot'; ExcludeFiles = @(); }"
    volumes:
      - ${LICENSE_PATH}:C:\license
      - .\data\cm:C:\inetpub\wwwroot\App_Data\logs
      - .\code:C:\src
      - C:\Program Files (x86)\Microsoft Visual Studio\2019\Professional\Common7\IDE\Remote Debugger:C:\remote_debugger:ro
    ports:
      - "44001:80"
      - "4024:4024"
    links:
      - sql
      - solr
Run
docker-compose down, save that change and then run
docker-compose up
again, and now we can attach to localhost:
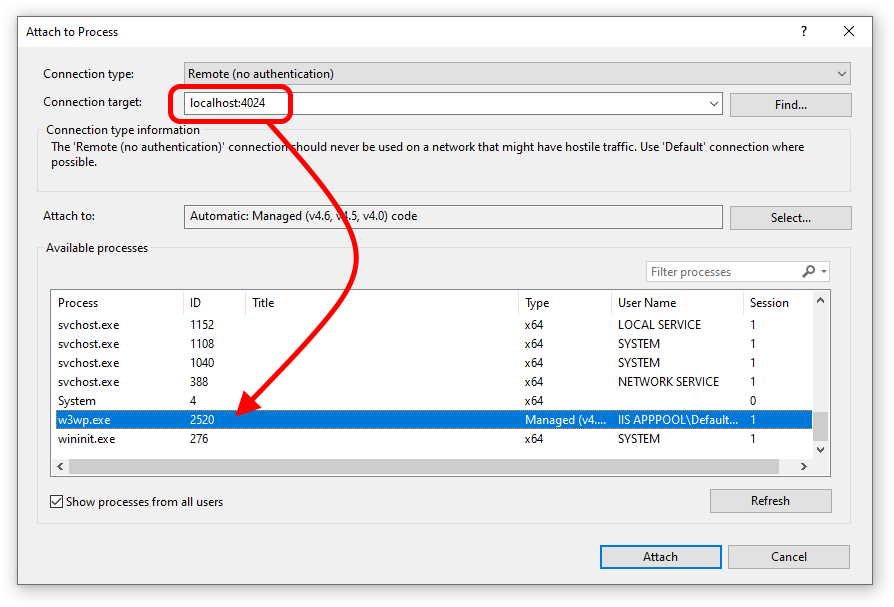
I've stuck with the standard port of 4024 here – but you can use whatever port mapping you like.
I'll bet there are other ways – maybe better ones – but that's investigation for another day...
Edited to add: Yes, there are other ways! On Twitter Reto Hugi pointed me at this interesting post by Rob Ahnemann, which takes another approach: Using another container to dynamically rewrite your hosts file.↑ Back to top